Box Plots
Box and Whiskers plots are generally used to understand the distribution of the data given some categorical dimension. Both matplotlib and seaborn provide functions to render these plots. We will use the iris dataset as an example for how to implement this in python.
import pandas as pd
import matplotlib.pyplot as plt
from sklearn import datasets

%matplotlib inline
%config InlineBackend.figure_format = 'retina'
Loading the iris dataset
iris = datasets.load_iris()
iris_df = pd.DataFrame(iris.data, columns=iris.feature_names)

def convert_species(x):
    if x == 0:
        return 'Setosa'
    elif x == 1:
        return 'Versicolour'
    elif x == 2:
        return "Virginica"
    else:
        return 'Unknown'


iris_df['Species'] = [ convert_species(x)  for x in iris.target ]
iris_df.head()| sepal length (cm) | sepal width (cm) | petal length (cm) | petal width (cm) | Species |
|---|---|---|---|---|
| 5.1 | 3.5 | 1.4 | 0.2 | Setosa |
| 4.9 | 3.0 | 1.4 | 0.2 | Setosa |
| 4.7 | 3.2 | 1.3 | 0.2 | Setosa |
| 4.6 | 3.1 | 1.5 | 0.2 | Setosa |
| 5.0 | 3.6 | 1.4 | 0.2 | Setosa |
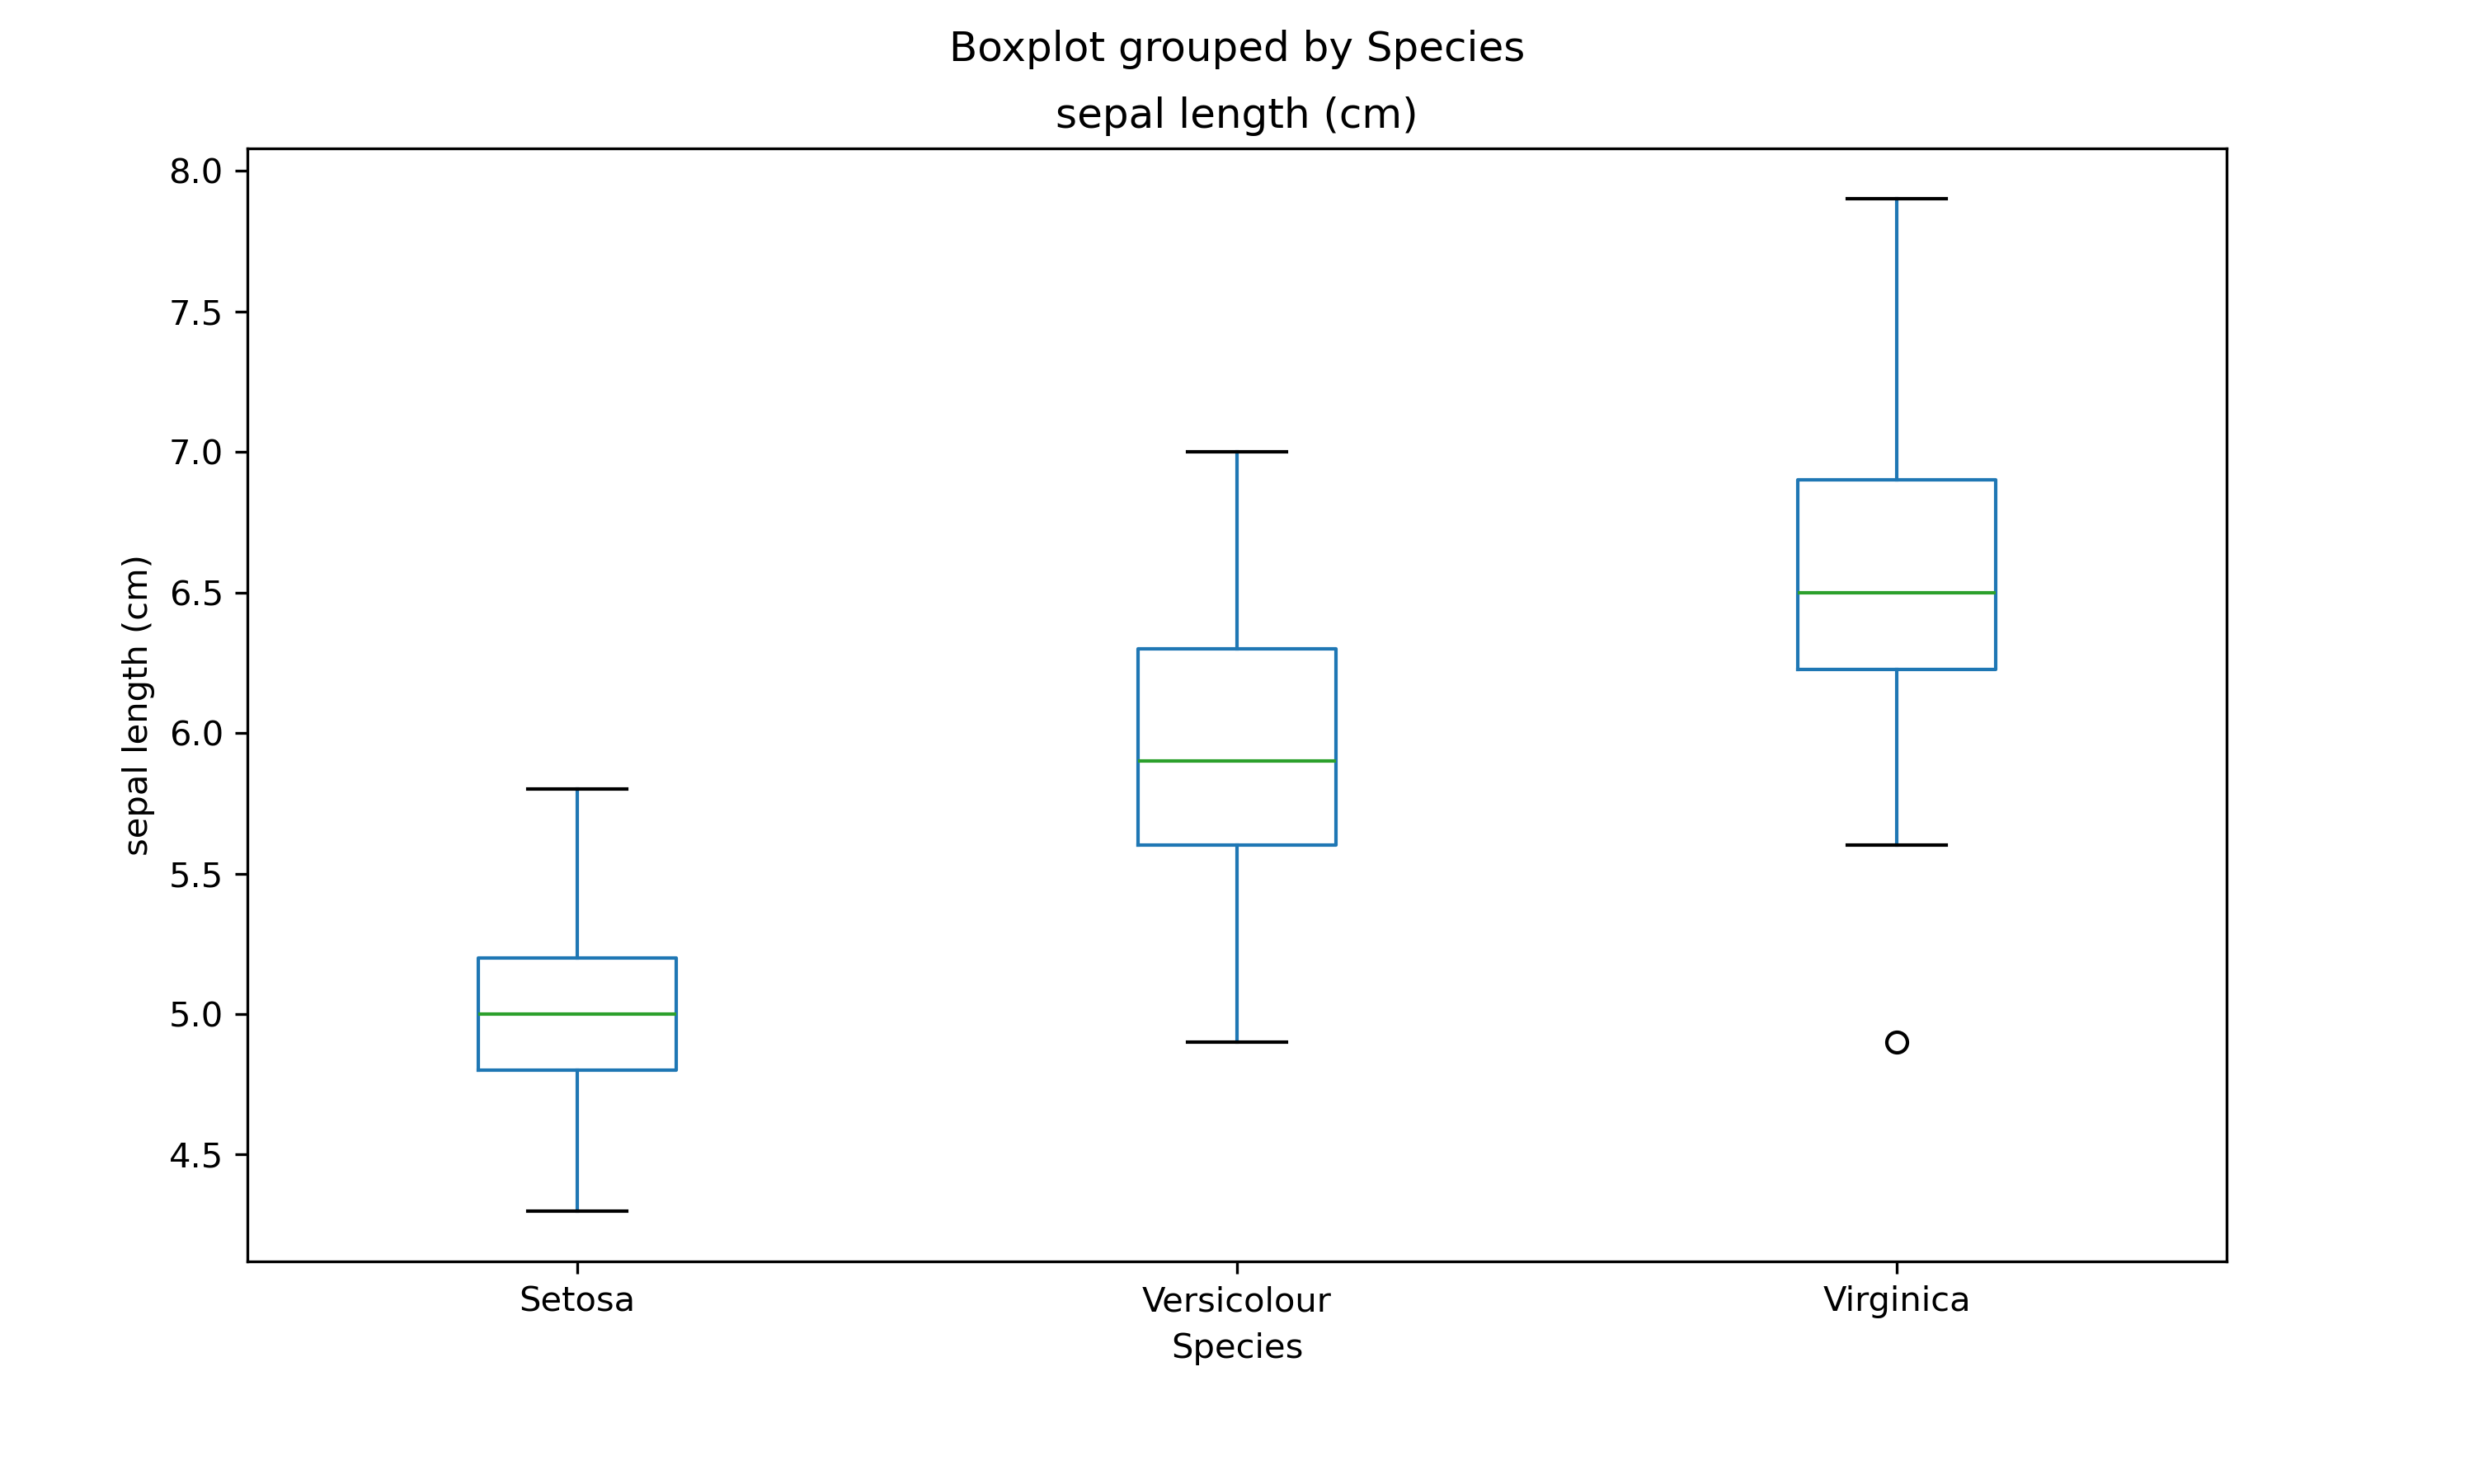
Matplotlib Box Plot
Similarly, we can use matplotlib to generate a box plot. In this case, we use pandas object and called the method boxplot. As a result, we need only supply the column for the box plot and the category column. This will then render the box plot. Notice that by default, seaborn provides colored plots as compared to matplotlib.
iris_df.boxplot(column='sepal length (cm)', by='Species', figsize=(10,6))
plt.ylabel('sepal length (cm)')
plt.grid(False)