Scatter Matrix
Scatter matrix is a one stop shop for gauage the correlation of all the components on your dataset. Just like a scatter plot, the scatter matrix plots scatter and distribution plots for all of the available observations and features in your dataframe.
Scatter matrices are build from a dataframe. In the code below, we load the boston dataset into a dataframe object before we plot the scatter matrix.
from sklearn import datasets
import pandas as pd
import matplotlib.pyplot as plt

%matplotlib inline
%config InlineBackend.figure_format = 'retina'
For simplicity, we will use the iris dataset because it sparsity. The iris data has 4 numeric variables and 1 categorical variable
iris = datasets.load_iris()
iris_df = pd.DataFrame(iris.data, columns=iris.feature_names)

def convert_species(x):
    if x == 0:
        return 'Setosa'
    elif x == 1:
        return 'Versicolour'
    elif x == 2:
        return "Virginica"
    else:
        return 'Unknown'


iris_df['Species'] = [ convert_species(x)  for x in iris.target ]
iris_df.head()| sepal length (cm) | sepal width (cm) | petal length (cm) | petal width (cm) | Species |
|---|---|---|---|---|
| 5.1 | 3.5 | 1.4 | 0.2 | Setosa |
| 4.9 | 3.0 | 1.4 | 0.2 | Setosa |
| 4.7 | 3.2 | 1.3 | 0.2 | Setosa |
| 4.6 | 3.1 | 1.5 | 0.2 | Setosa |
| 5.0 | 3.6 | 1.4 | 0.2 | Setosa |
Scatter Matrix
We use the scatter matrix to plot the relationship between all variables in the dataframe
_ = pd.plotting.scatter_matrix(iris_df, figsize=(18,12))
plt.tight_layout()
plt.suptitle('Iris Dataset Scatter Matrix', size=16, y = 1.02)
plt.show()
Kernel Density Diagonal
Notice that in the above plot, the diagonal plots are histograms to show the distribution of the variable. We can use the density plot to show a smoother distribution of the metric.
_ = pd.plotting.scatter_matrix(iris_df, figsize=(15,10), diagonal='kde')
plt.tight_layout()
plt.suptitle('Iris Dataset Scatter Matrix with KDE', size=16, y = 1.02)
plt.show()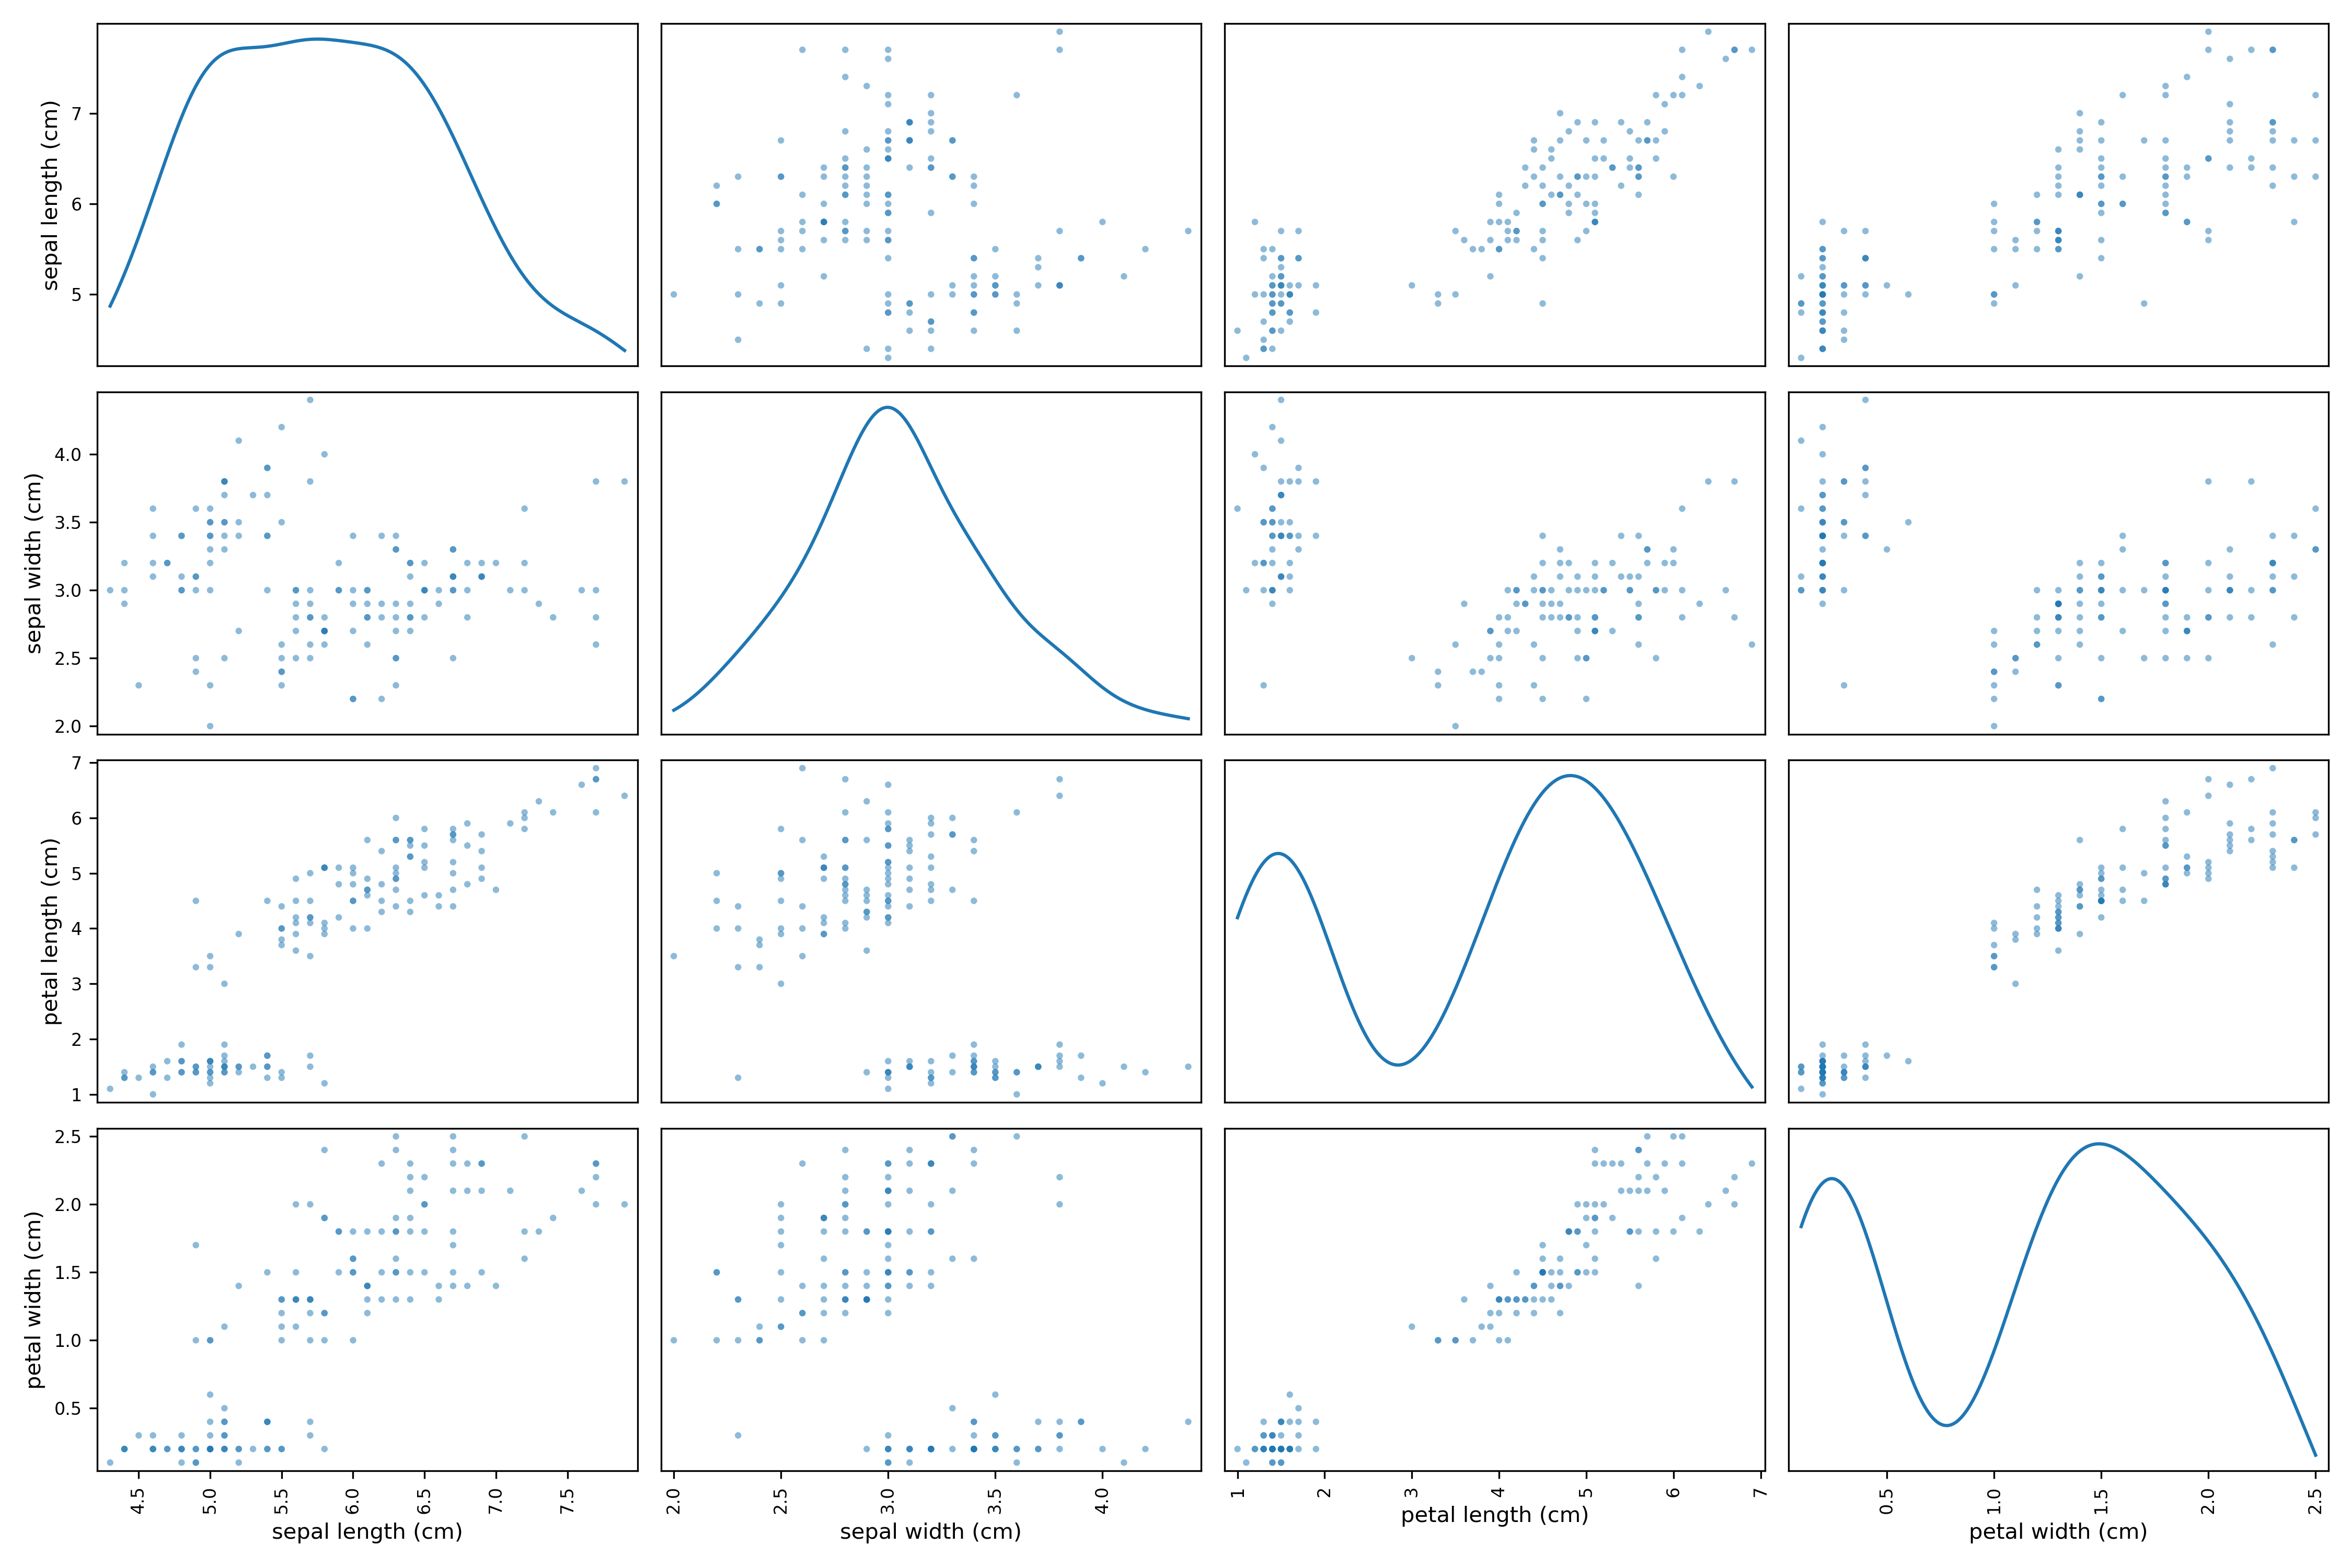
You can see that scatter matrix can be incredibly useful to evaluate all the metrics available in your dataframe. We can detect early on the relationship between variables and the nature of the distribution of the variable.