Stacked Bar Plots
A different approach to a side by side bar charts by category is the stacked bar plot which represents every game by a unit color accross all the players. We initialize the stacked keyword argument to True to return this result.
sample_data.plot(kind='bar',stacked=True, figsize=(10,6))
plt.title('World Cup 2018 All Games Goals Scored')
plt.ylabel('Goals Scored')
plt.legend(loc='center left', bbox_to_anchor=(1, .5))
plt.tight_layout()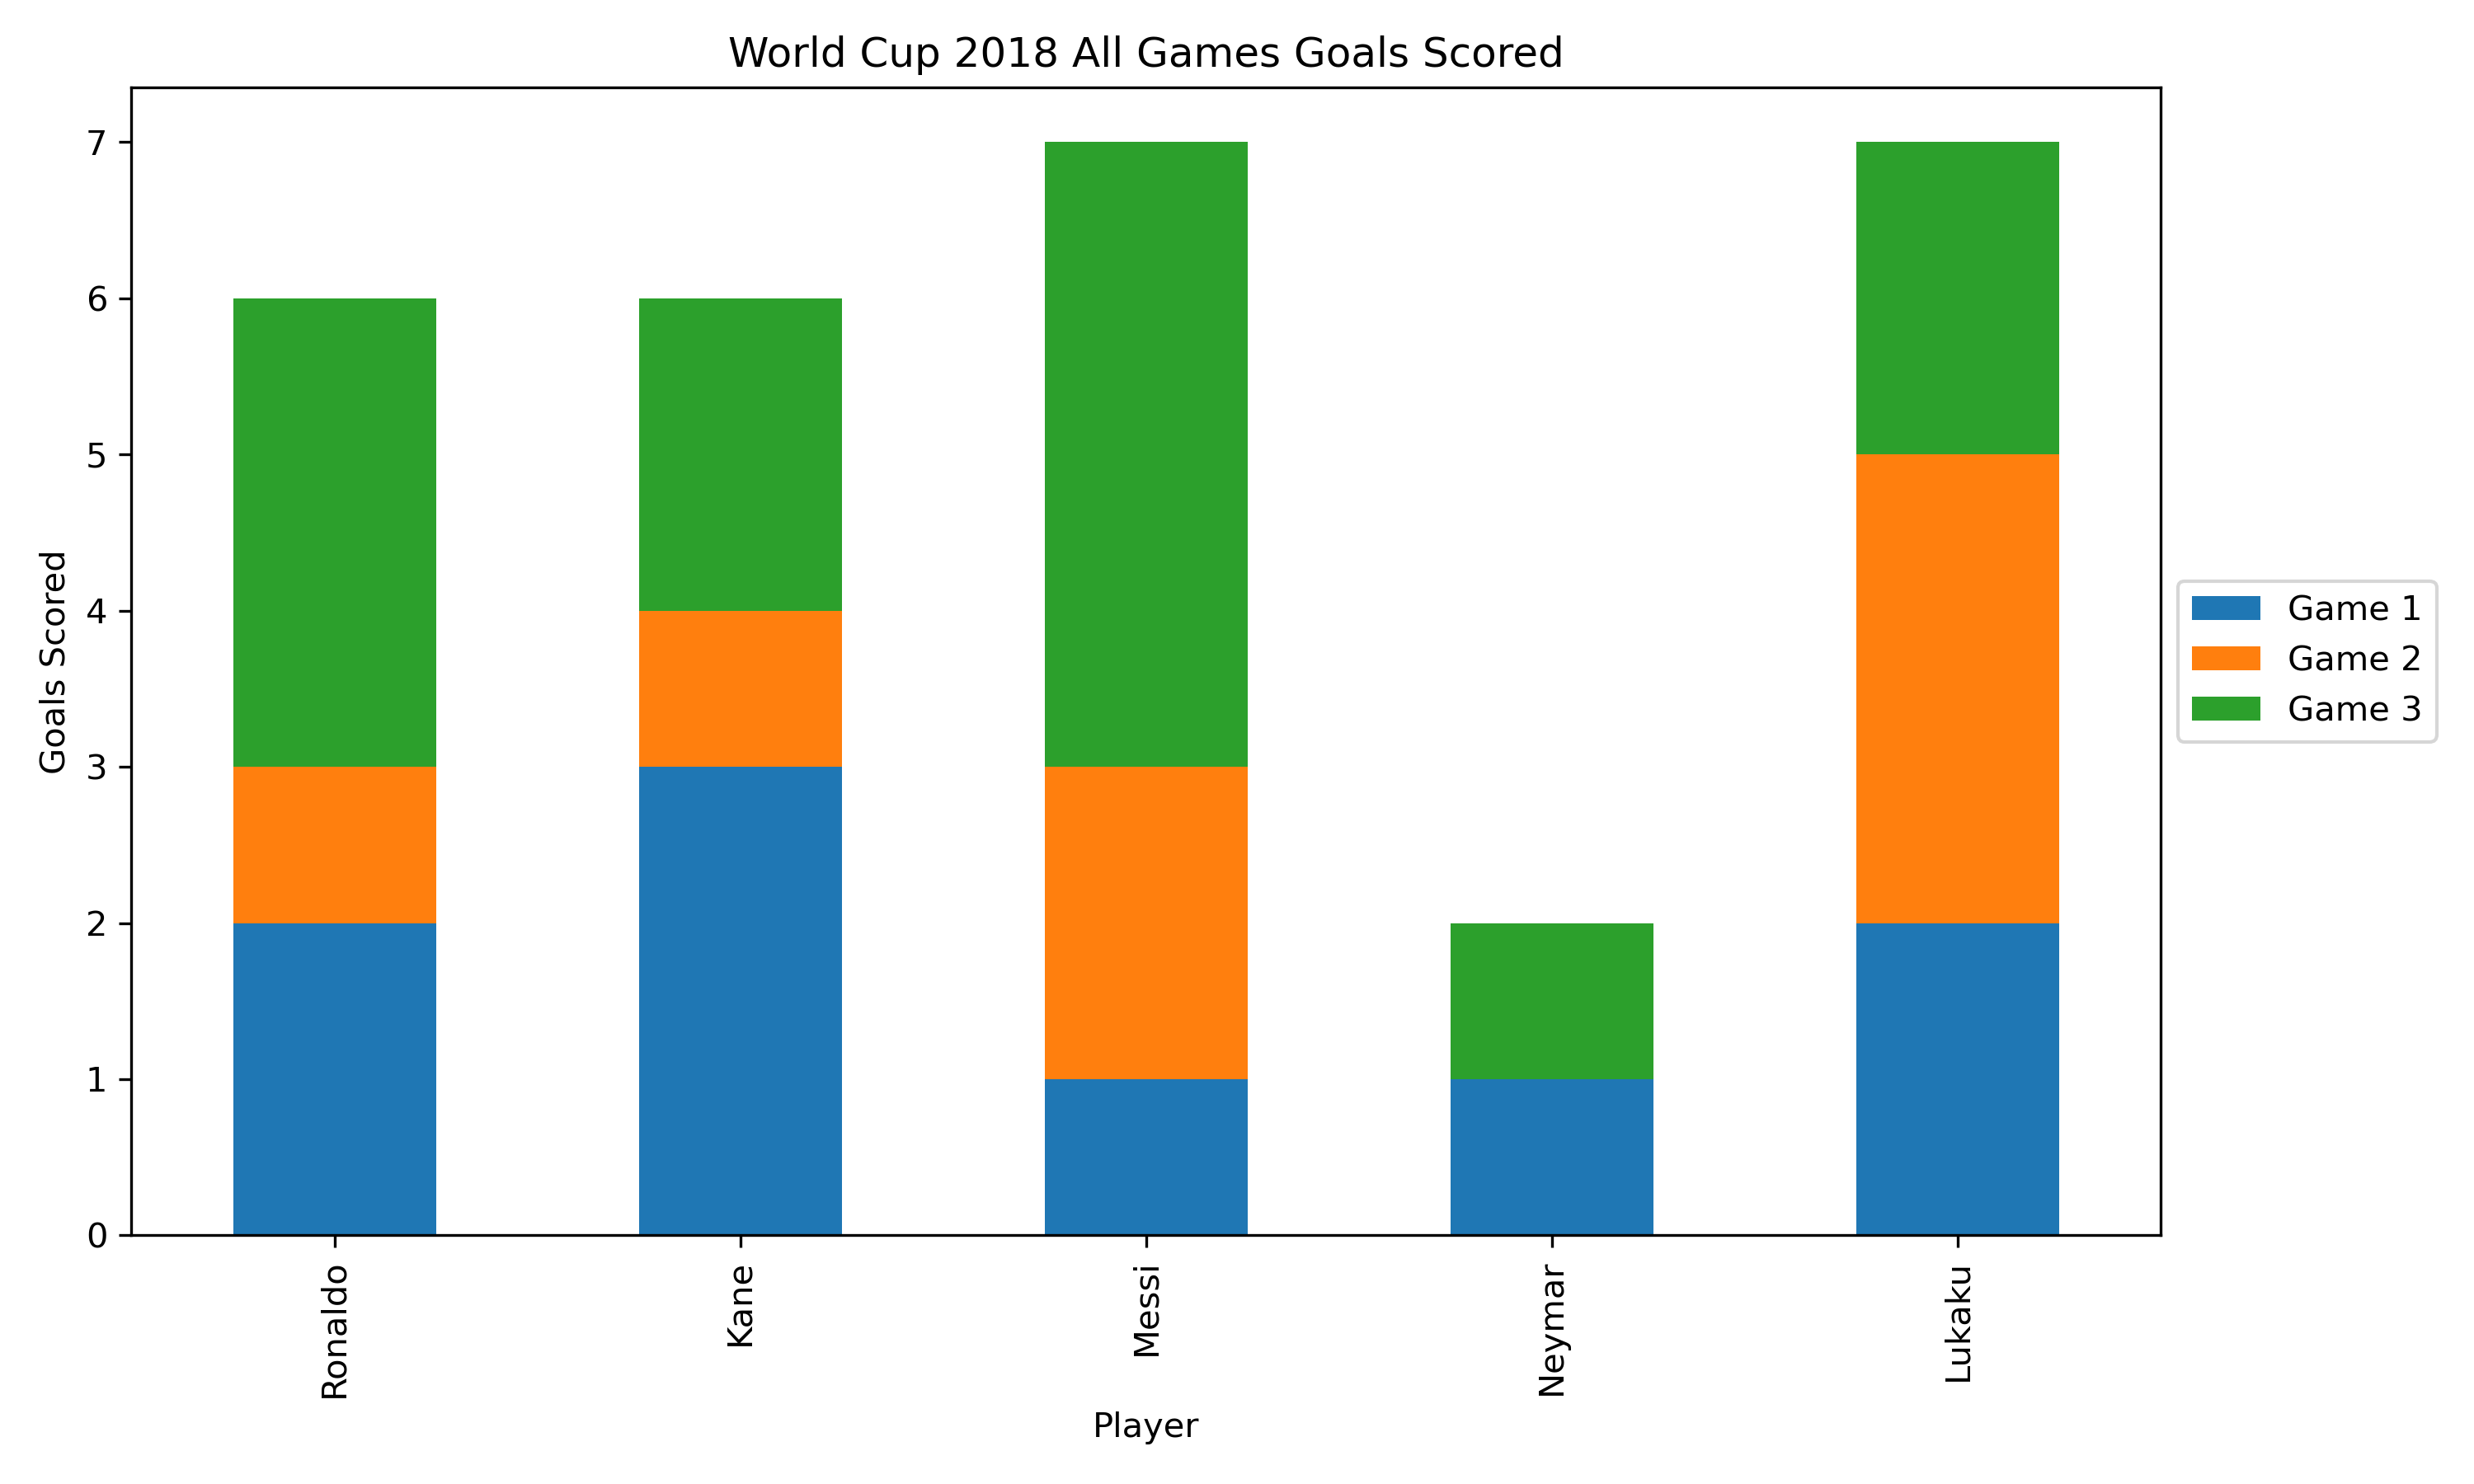
Stacked Horizontal
Just like we did with multiple plots, we can render the stacked plots in a horizontal layout. We simply change the type of the chart to barh
sample_data.plot(kind='barh',stacked=True, figsize=(10,6))
plt.title('World Cup 2018 All Games Goals Scored')
plt.ylabel('Goals Scored')
plt.legend(loc='center left', bbox_to_anchor=(1, .5))
plt.tight_layout()
plt.show()