Axes Spines
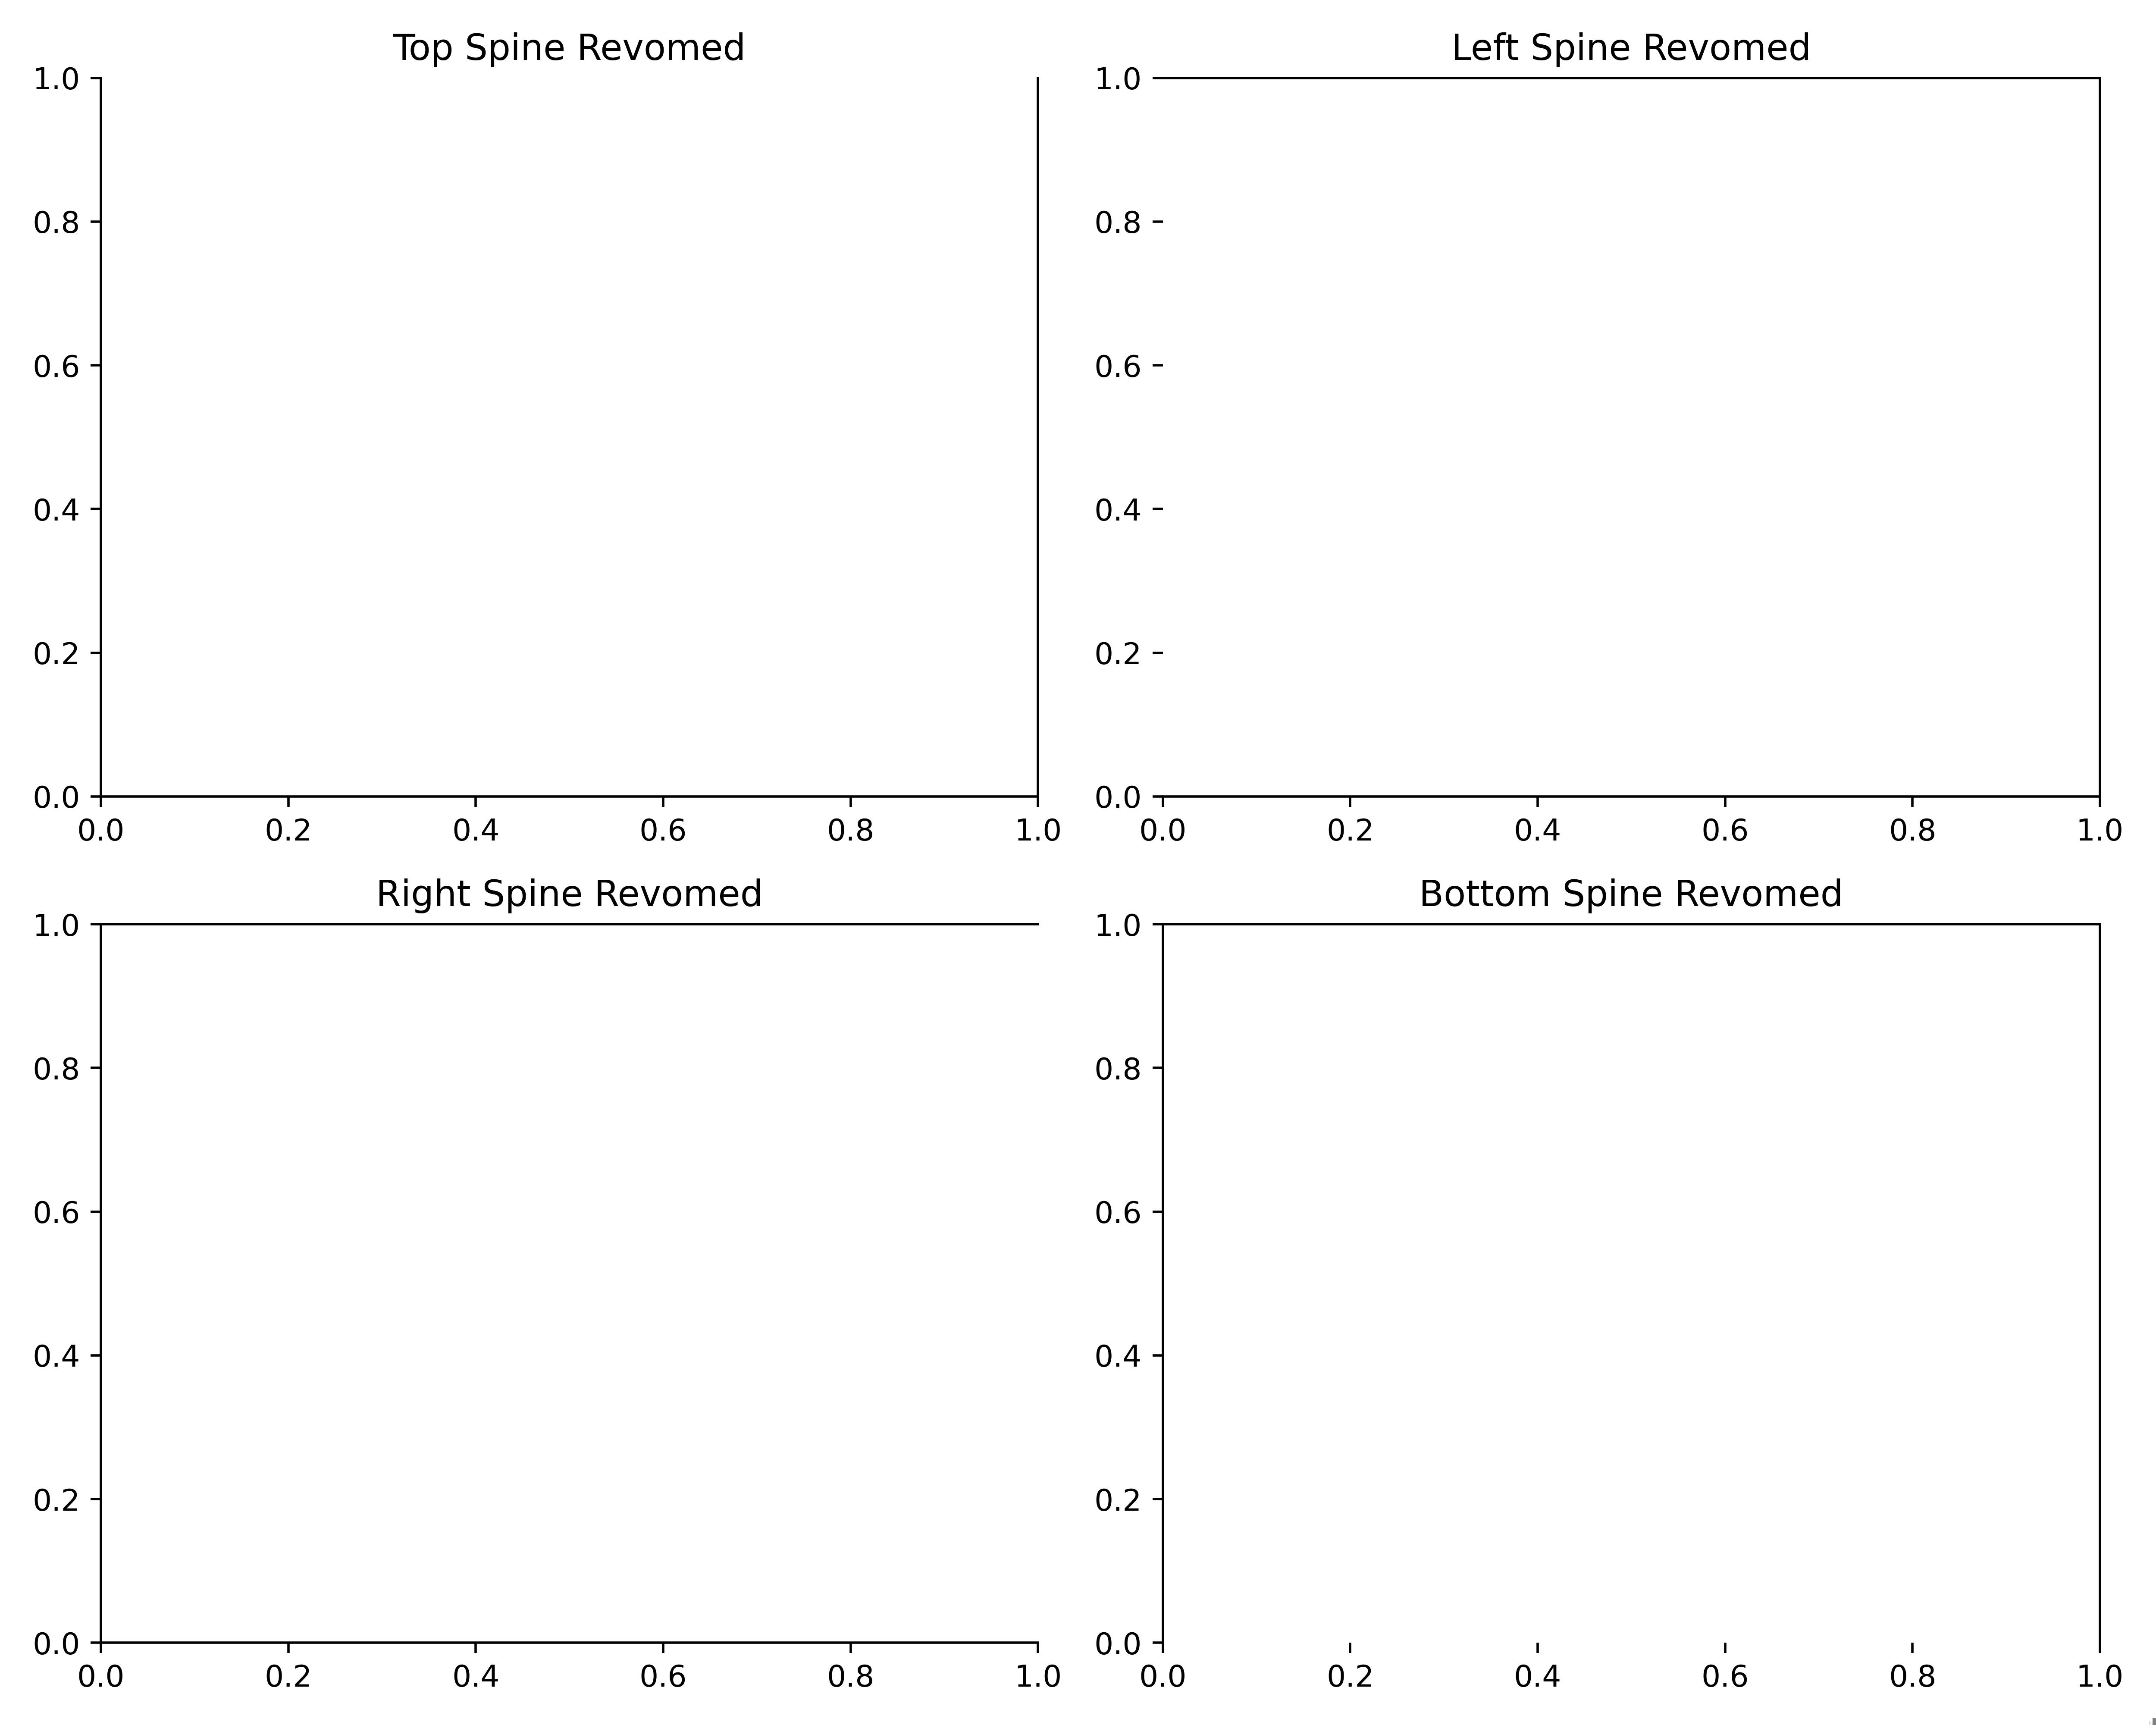
Matplotlib Axes Spines refer to the borders of the plot —
The code below demonstrates the presence and location of spines by changing the visibility of each spine by plot.
import matplotlib.pyplot as plt
import numpy as np

%matplotlib inline
%config InlineBackend.figure_format = 'retina'
fig, ax = plt.subplots( figsize=(10,8), dpi=500, nrows=2, ncols=2)
ax[0, 0].spines['top'].set_visible(False)
ax[0, 0].set_title('Top Spine Revomed')
ax[0, 1].spines['left'].set_visible(False)
ax[0, 1].set_title('Left Spine Revomed')
ax[1, 0].spines['right'].set_visible(False)
ax[1, 0].set_title('Right Spine Revomed')
ax[1, 1].spines['bottom'].set_visible(False)
ax[1, 1].set_title('Bottom Spine Revomed')
Working with Spines
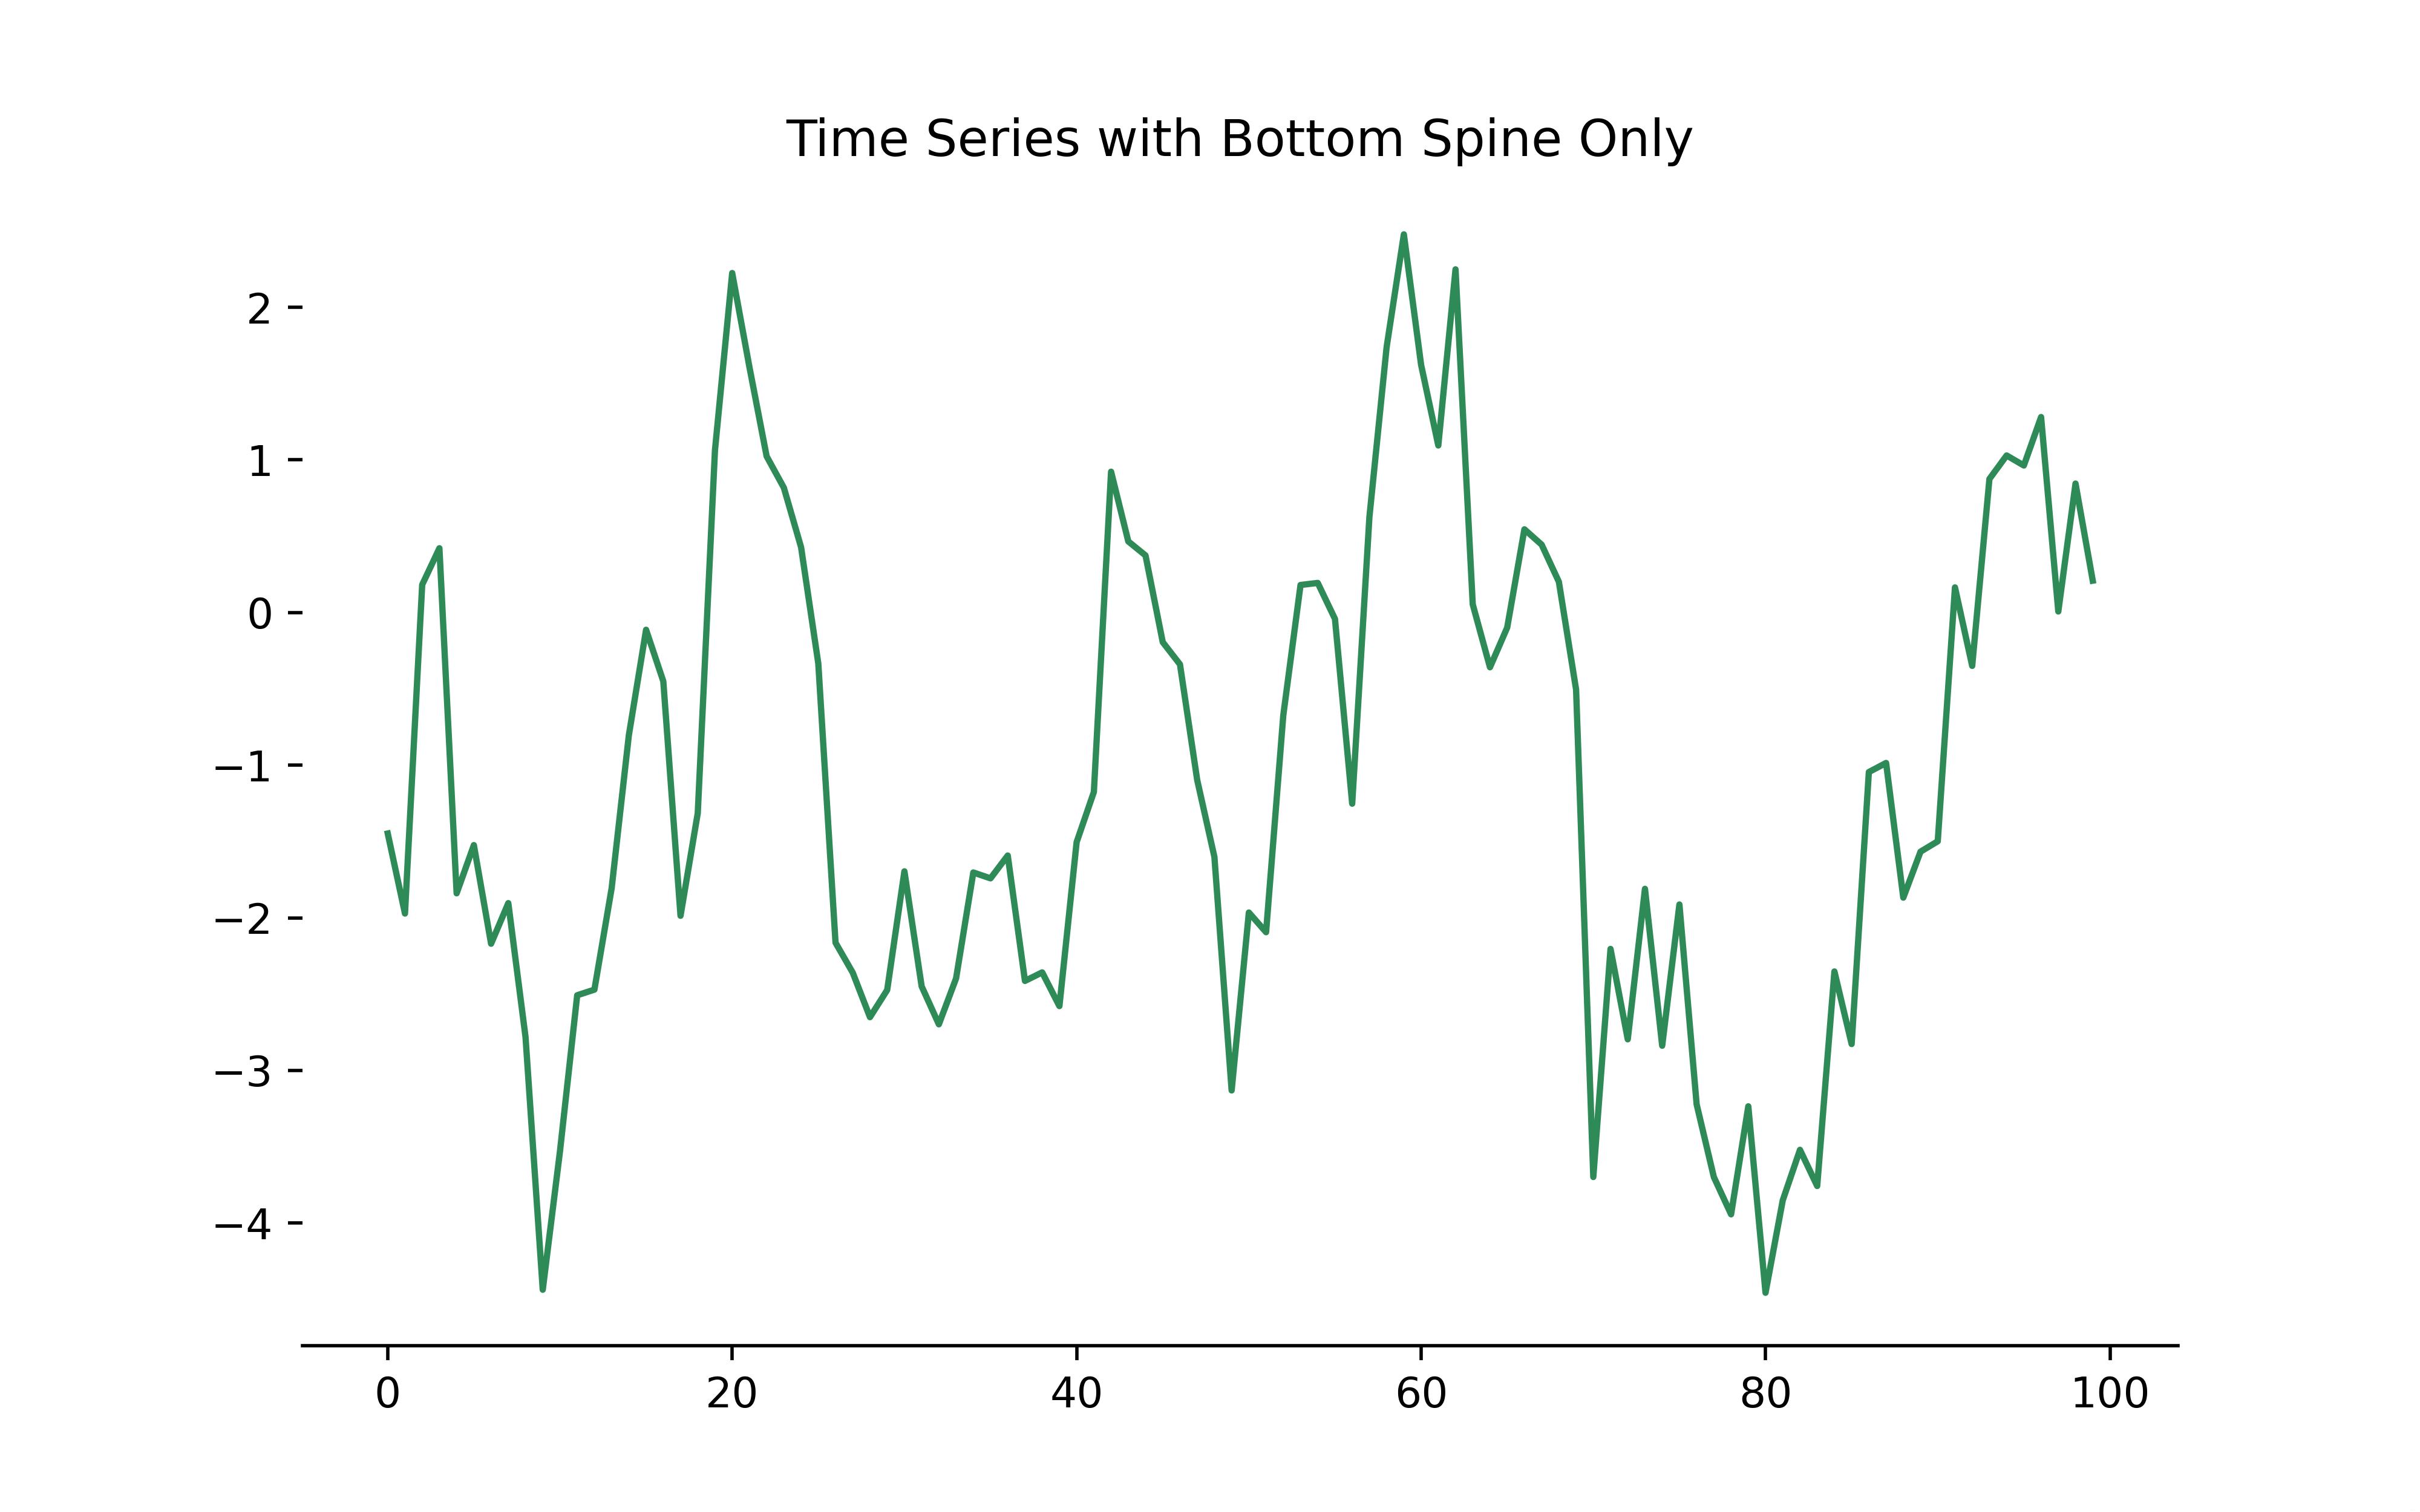
Working with spines can help you create a cleaner visual for your needs. The example below generates a time series plot with only the bottom spine.
Removing specific spines to create a cleaner visual. The example below retains only the bottom spine.
# Generate time series data
num_points = 100
time = np.arange(num_points)
data = np.cumsum(np.random.randn(num_points))

# Create a Figure and Axes
fig, ax = plt.figure(figsize=(8,5), dpi=500), plt.axes()

# Plot the time series data
ax.plot(time, data, c ='seagreen')
ax.spines[['top', 'left', 'right']].set_visible(False)

# set title of the plot
ax.set_title('Time Series with Bottom Spine Only')
Moving the Spines Position
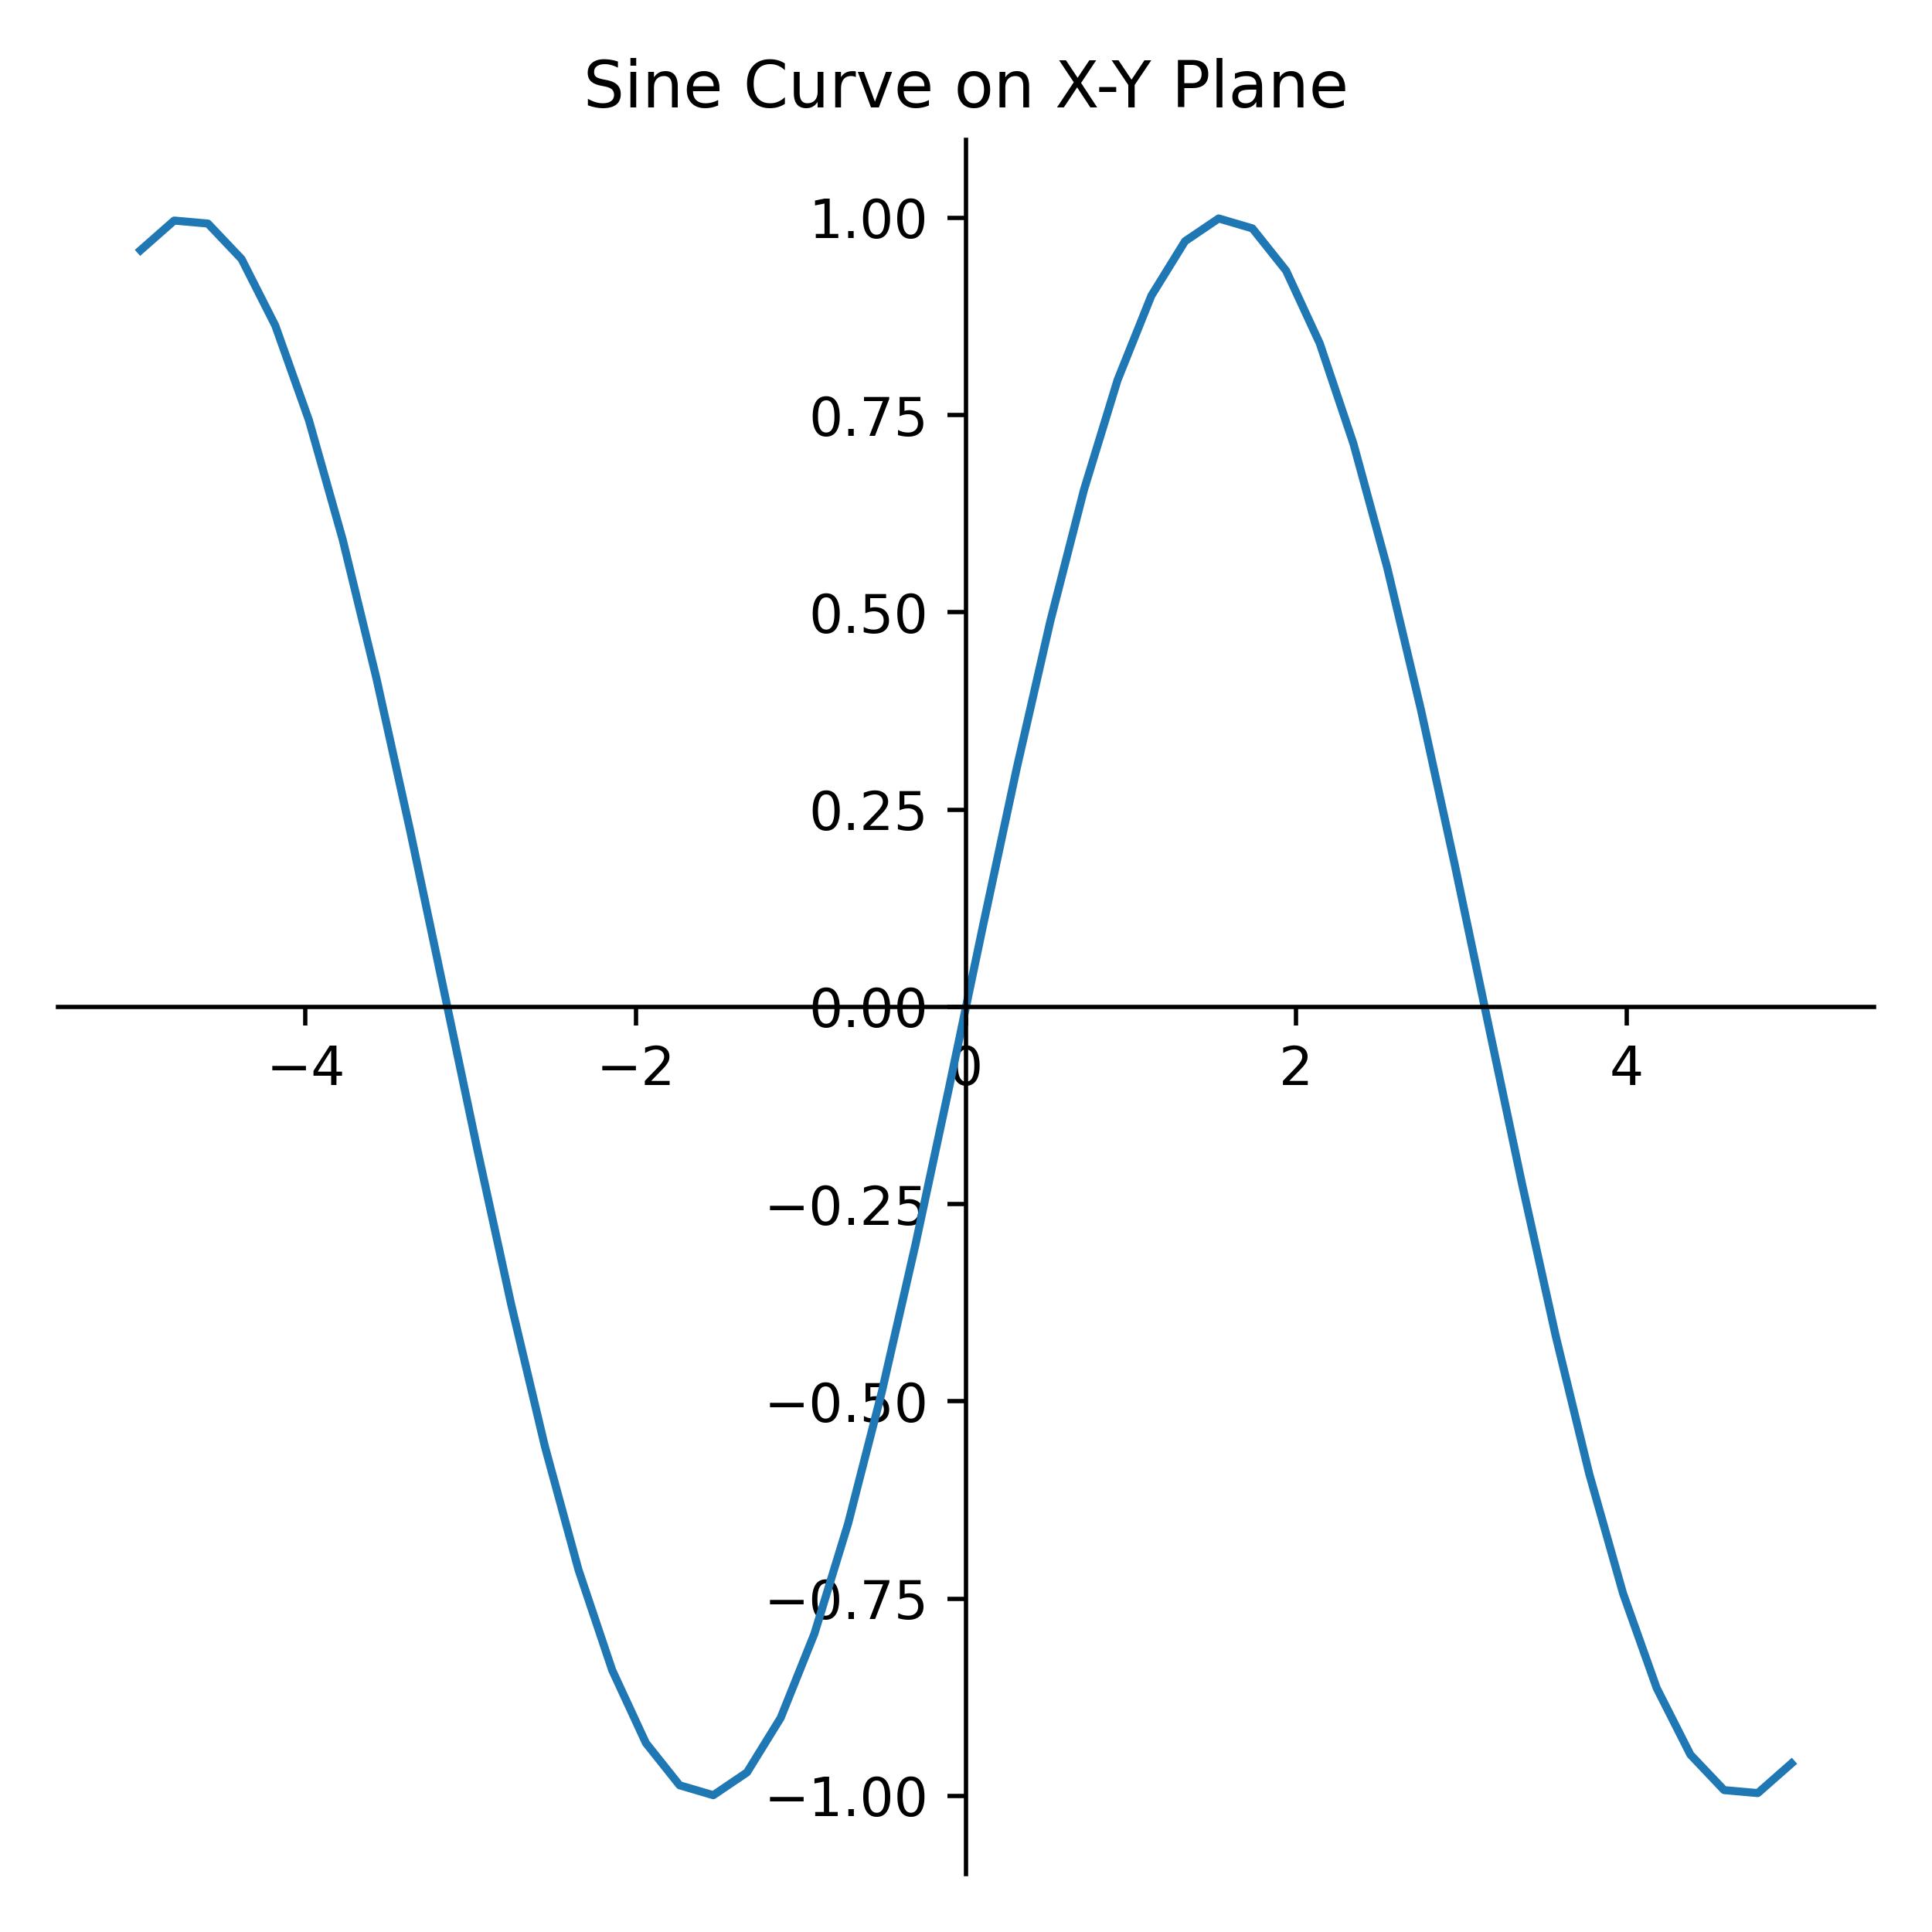
Repositioning the spines can create a different visual effect on your charts. The example below converts a sine curve from a plot into an x-y plane.
# Create a Figure and Axes
fig, ax = plt.figure(figsize=(5,5), dpi=500), plt.axes()

x = np.linspace(-5, 5, 50)
y = np.sin(x)

ax.plot(x, y)
ax.spines[['top', 'right']].set_visible(False)
ax.spines[['bottom', 'left']].set_position('zero')
ax.set_title('Sine Curve on X-Y Plane')