Box Plot for Distributions
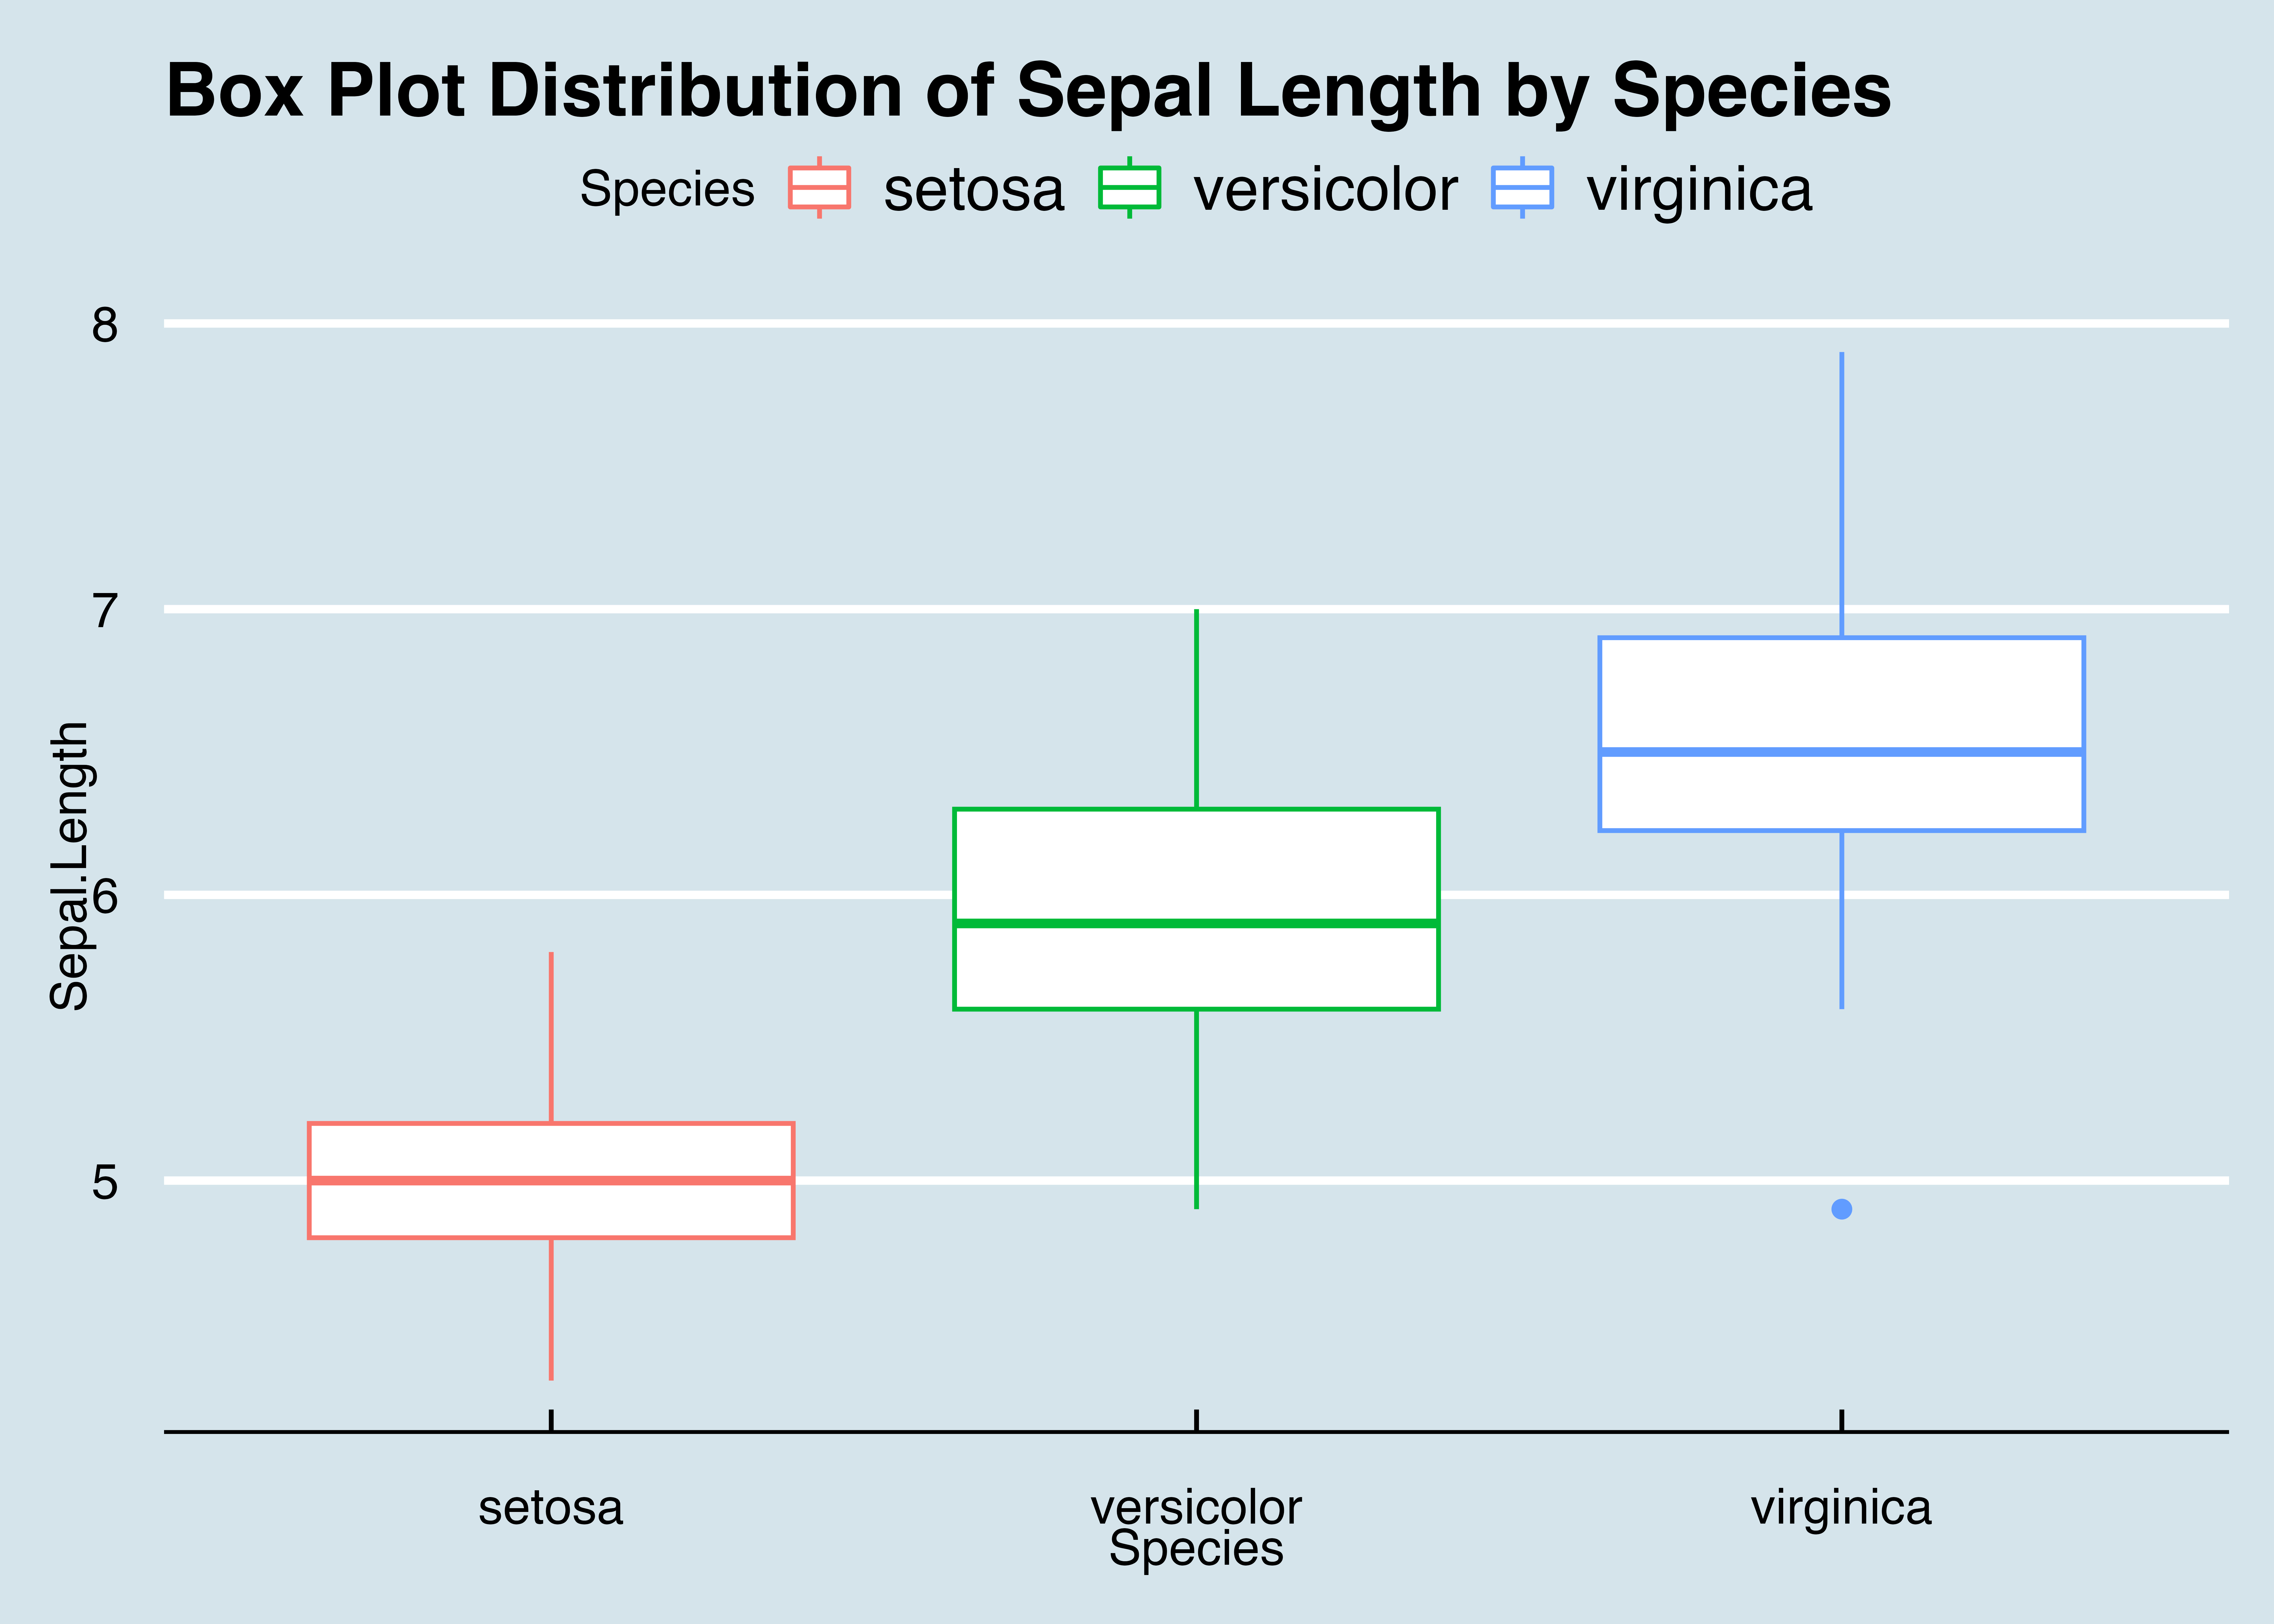
Box plots give us a visualization about how the univariate data points are distributed.
The code implementation below generates a box plot to visualize the distribution of Sepal Length against the different species of the iris dataset
library(ggplot2)
library(ggthemes)
library(datasets)
box = ggplot( data = iris, aes( x = Species ,
y = Sepal.Length,
color = Species )) + geom_boxplot()
box + ggtitle("Box Plot Distribution of Sepal Length by Species") + theme_economist()