Multi-Histogram Distributions
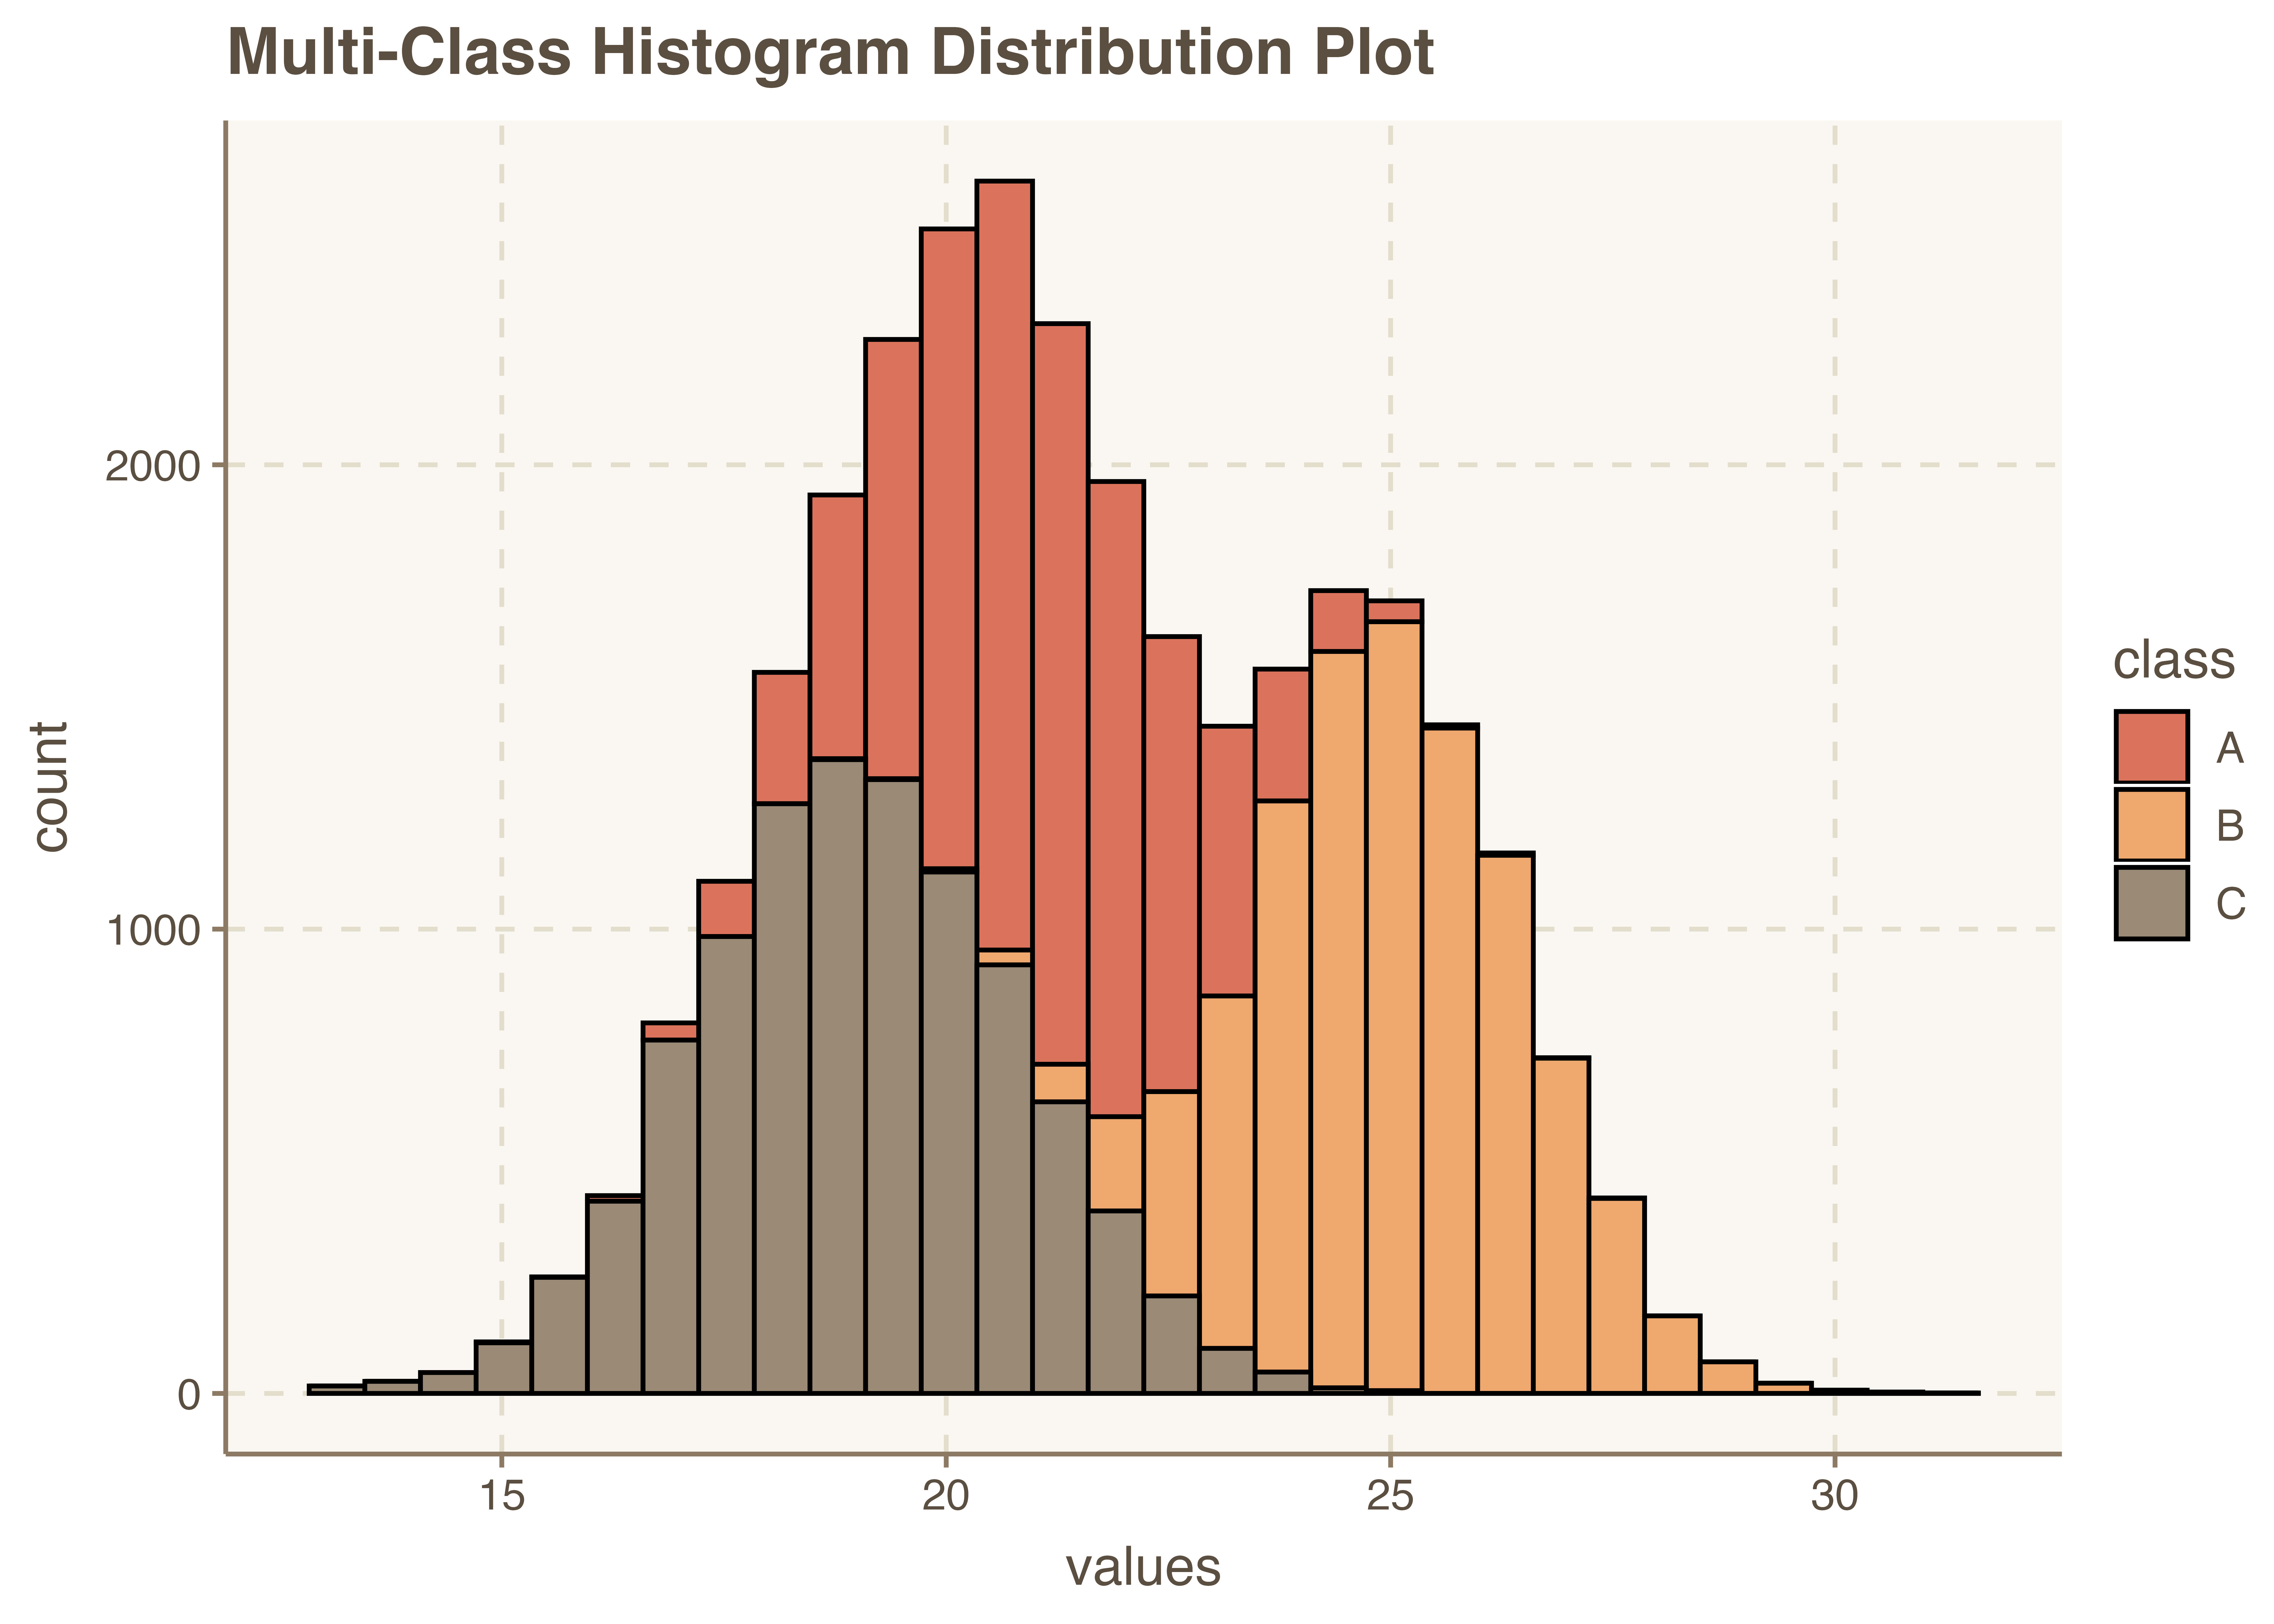
Comparing histograms across classes can provide useful information about the nature of the data you are working with. The implementation belows demostrates how to achieve this using ggplot. I begin by generating random data for the distribution.
library(ggthemr)
library(ggplot2)

ggthemr("dust")


x = rnorm(n = 10000, mean = 21, sd = 1.5)
y = rnorm(n = 10000, mean = 25, sd = 1.5)
z = rnorm(n = 10000, mean = 19, sd = 1.8)
data = data.frame( values = c(x, y, z),
class = rep(c("A", "B", "C"), each = length(x)))
head(data)| values | class | |
|---|---|---|
| 1 | 23.74437 | A |
| 2 | 16.92297 | A |
| 3 | 19.04337 | A |
| 4 | 19.34535 | A |
| 5 | 21.86623 | A |
| 6 | 20.00213 | A |
options(repr.plot.width = 10, repr.plot.height = 8)

histograms = ggplot( data, aes( x = values,
                                fill = class )) +
                        geom_histogram( color = "black", bins=30) +
                        ggtitle("Multi-Class Histogram Distribution Plot ")

histograms