Scatter Plot
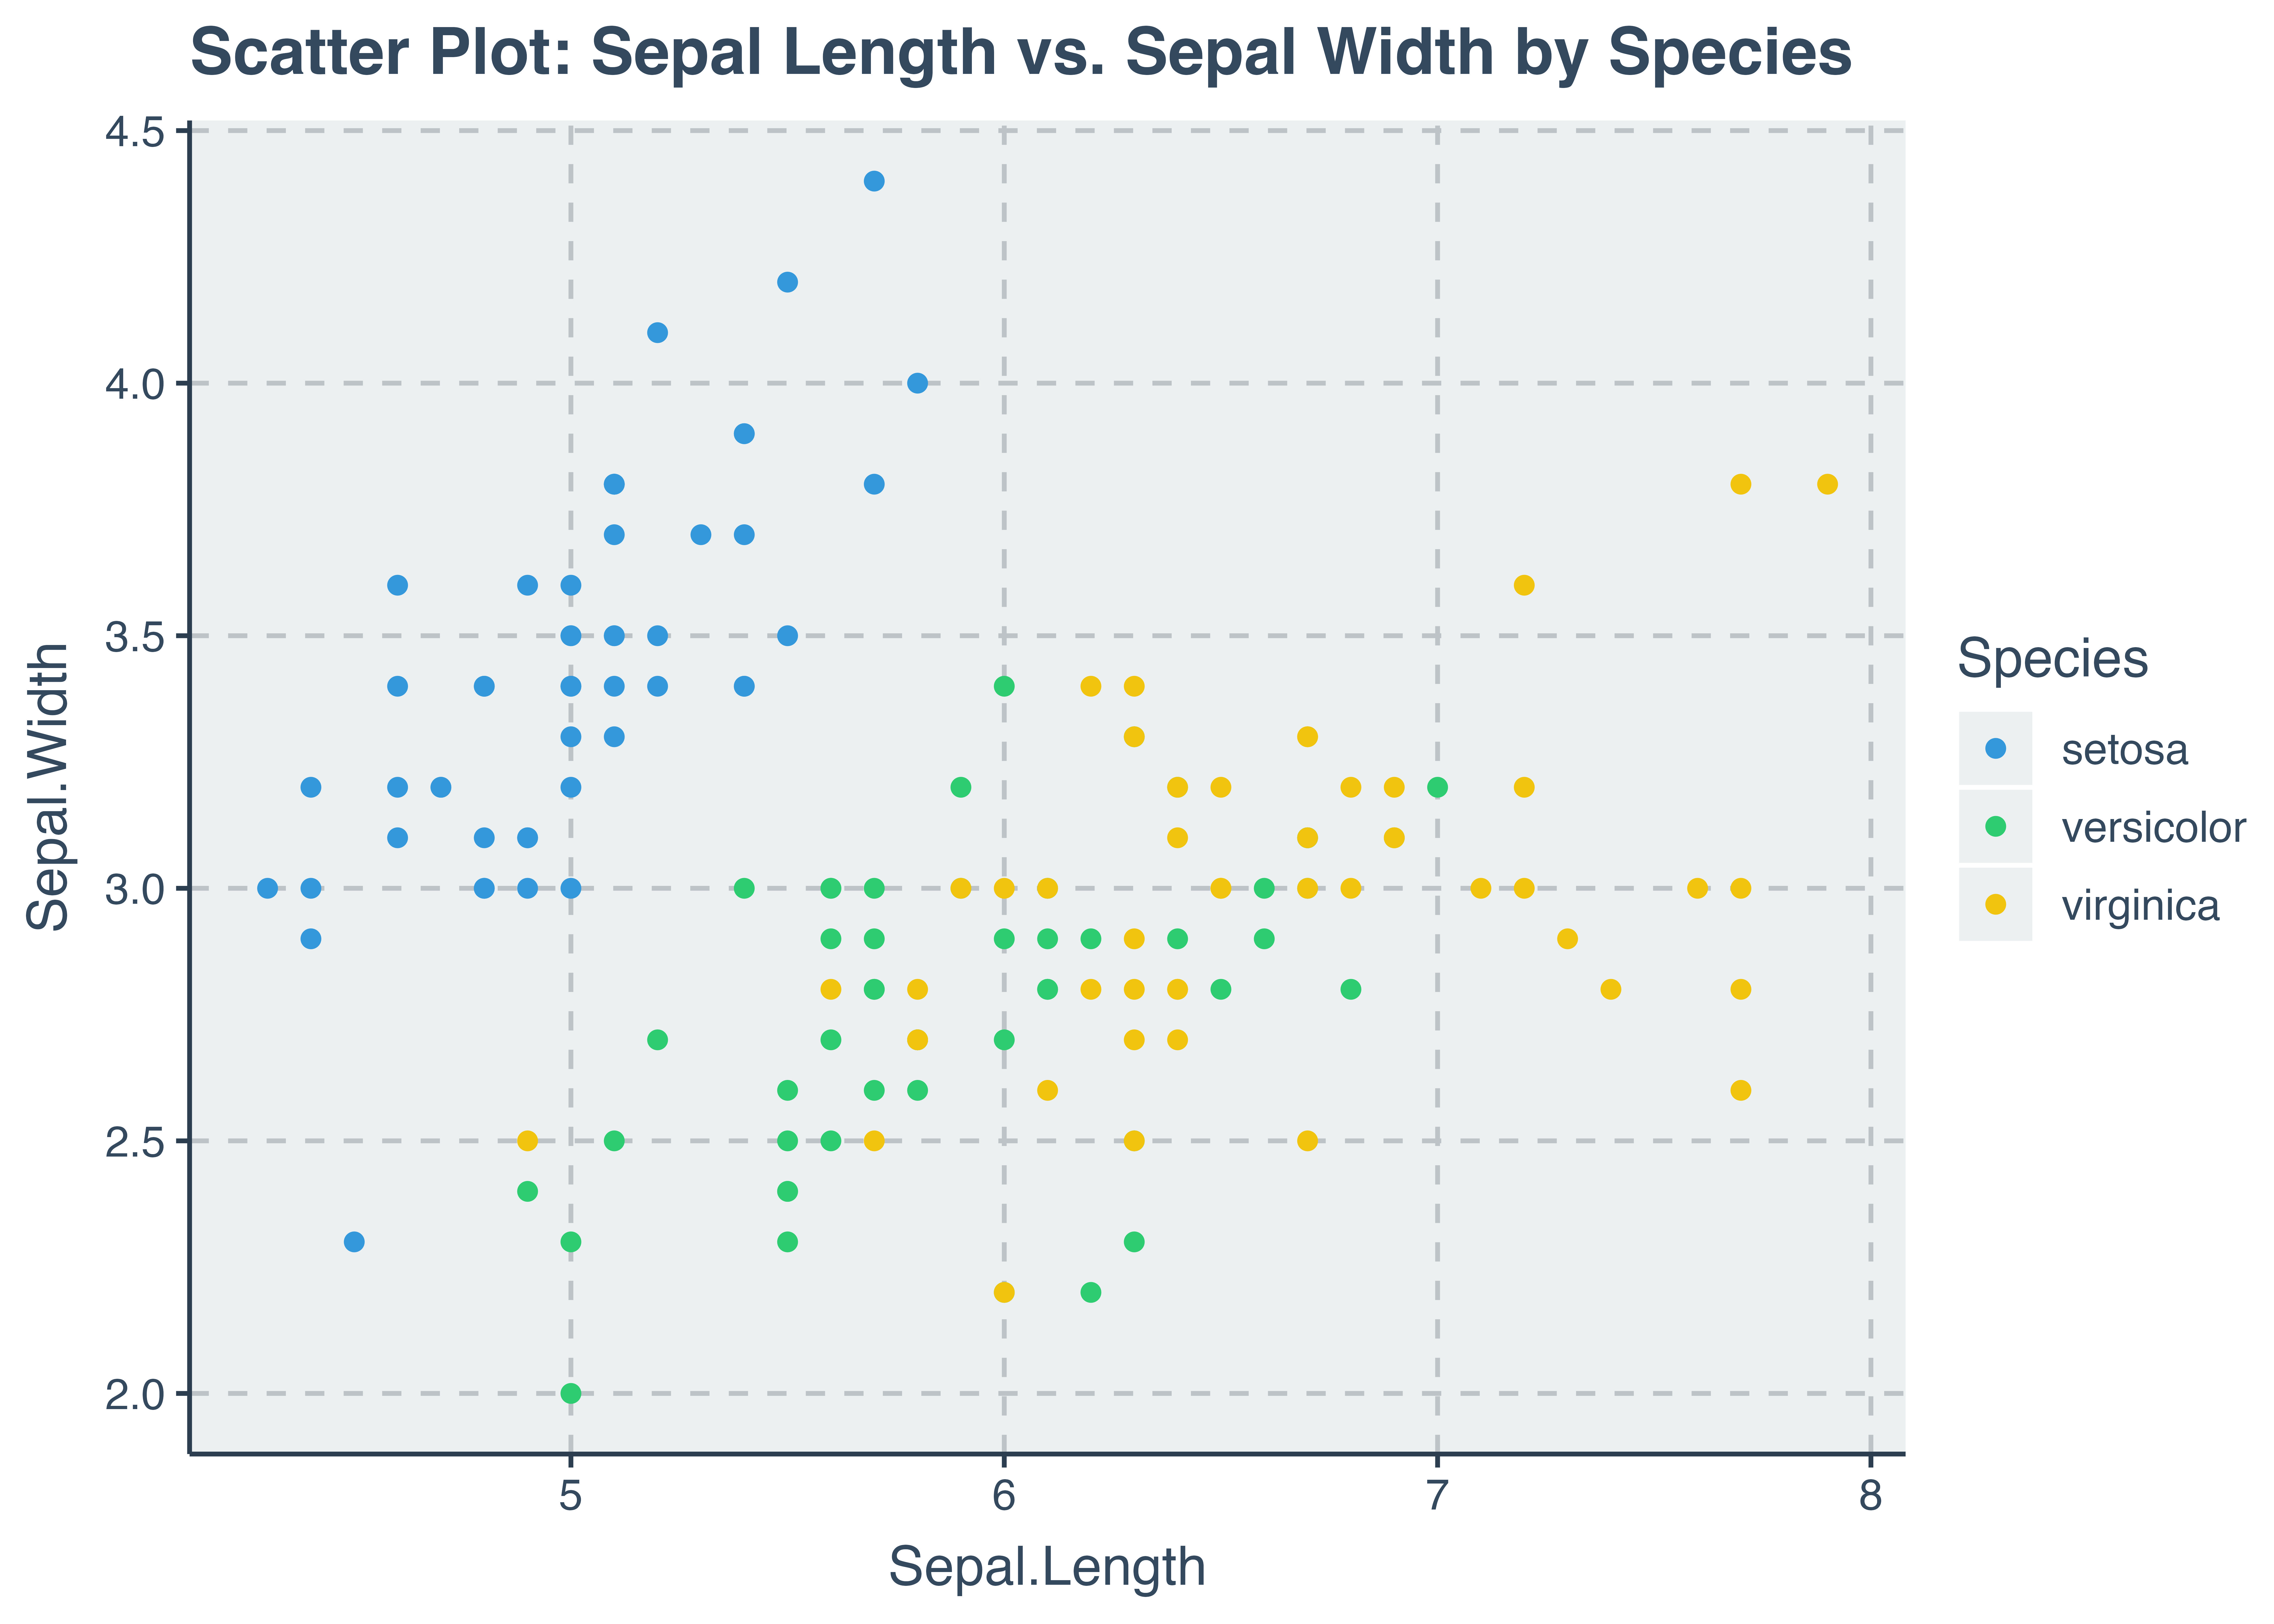
Scatterplots are useful in providing a visual representation of the spread and distribution of data across some $x$ and $y$ dimensions. The example below uses the well-known iris dataset in R.
library(ggplot2)
library(datasets)
library(ggthemr)
ggthemr('flat')
scatter = ggplot(data = iris,
aes( x = Sepal.Length,
y = Sepal.Width,
color = Species)) +
geom_point() +
labs( title = "Scatter Plot: Sepal Length vs. Sepal Width by Species" )
scatter