Scatter Plot Markers
Customizing scatter plot markers offers a versatile means to enhance the presentation of your visualizations. To achieve this, we pass the
The following examples demonstrate how to utilize scatter plot markers using R and
library(datasets)
library(ggplot2)
library(artyfarty)
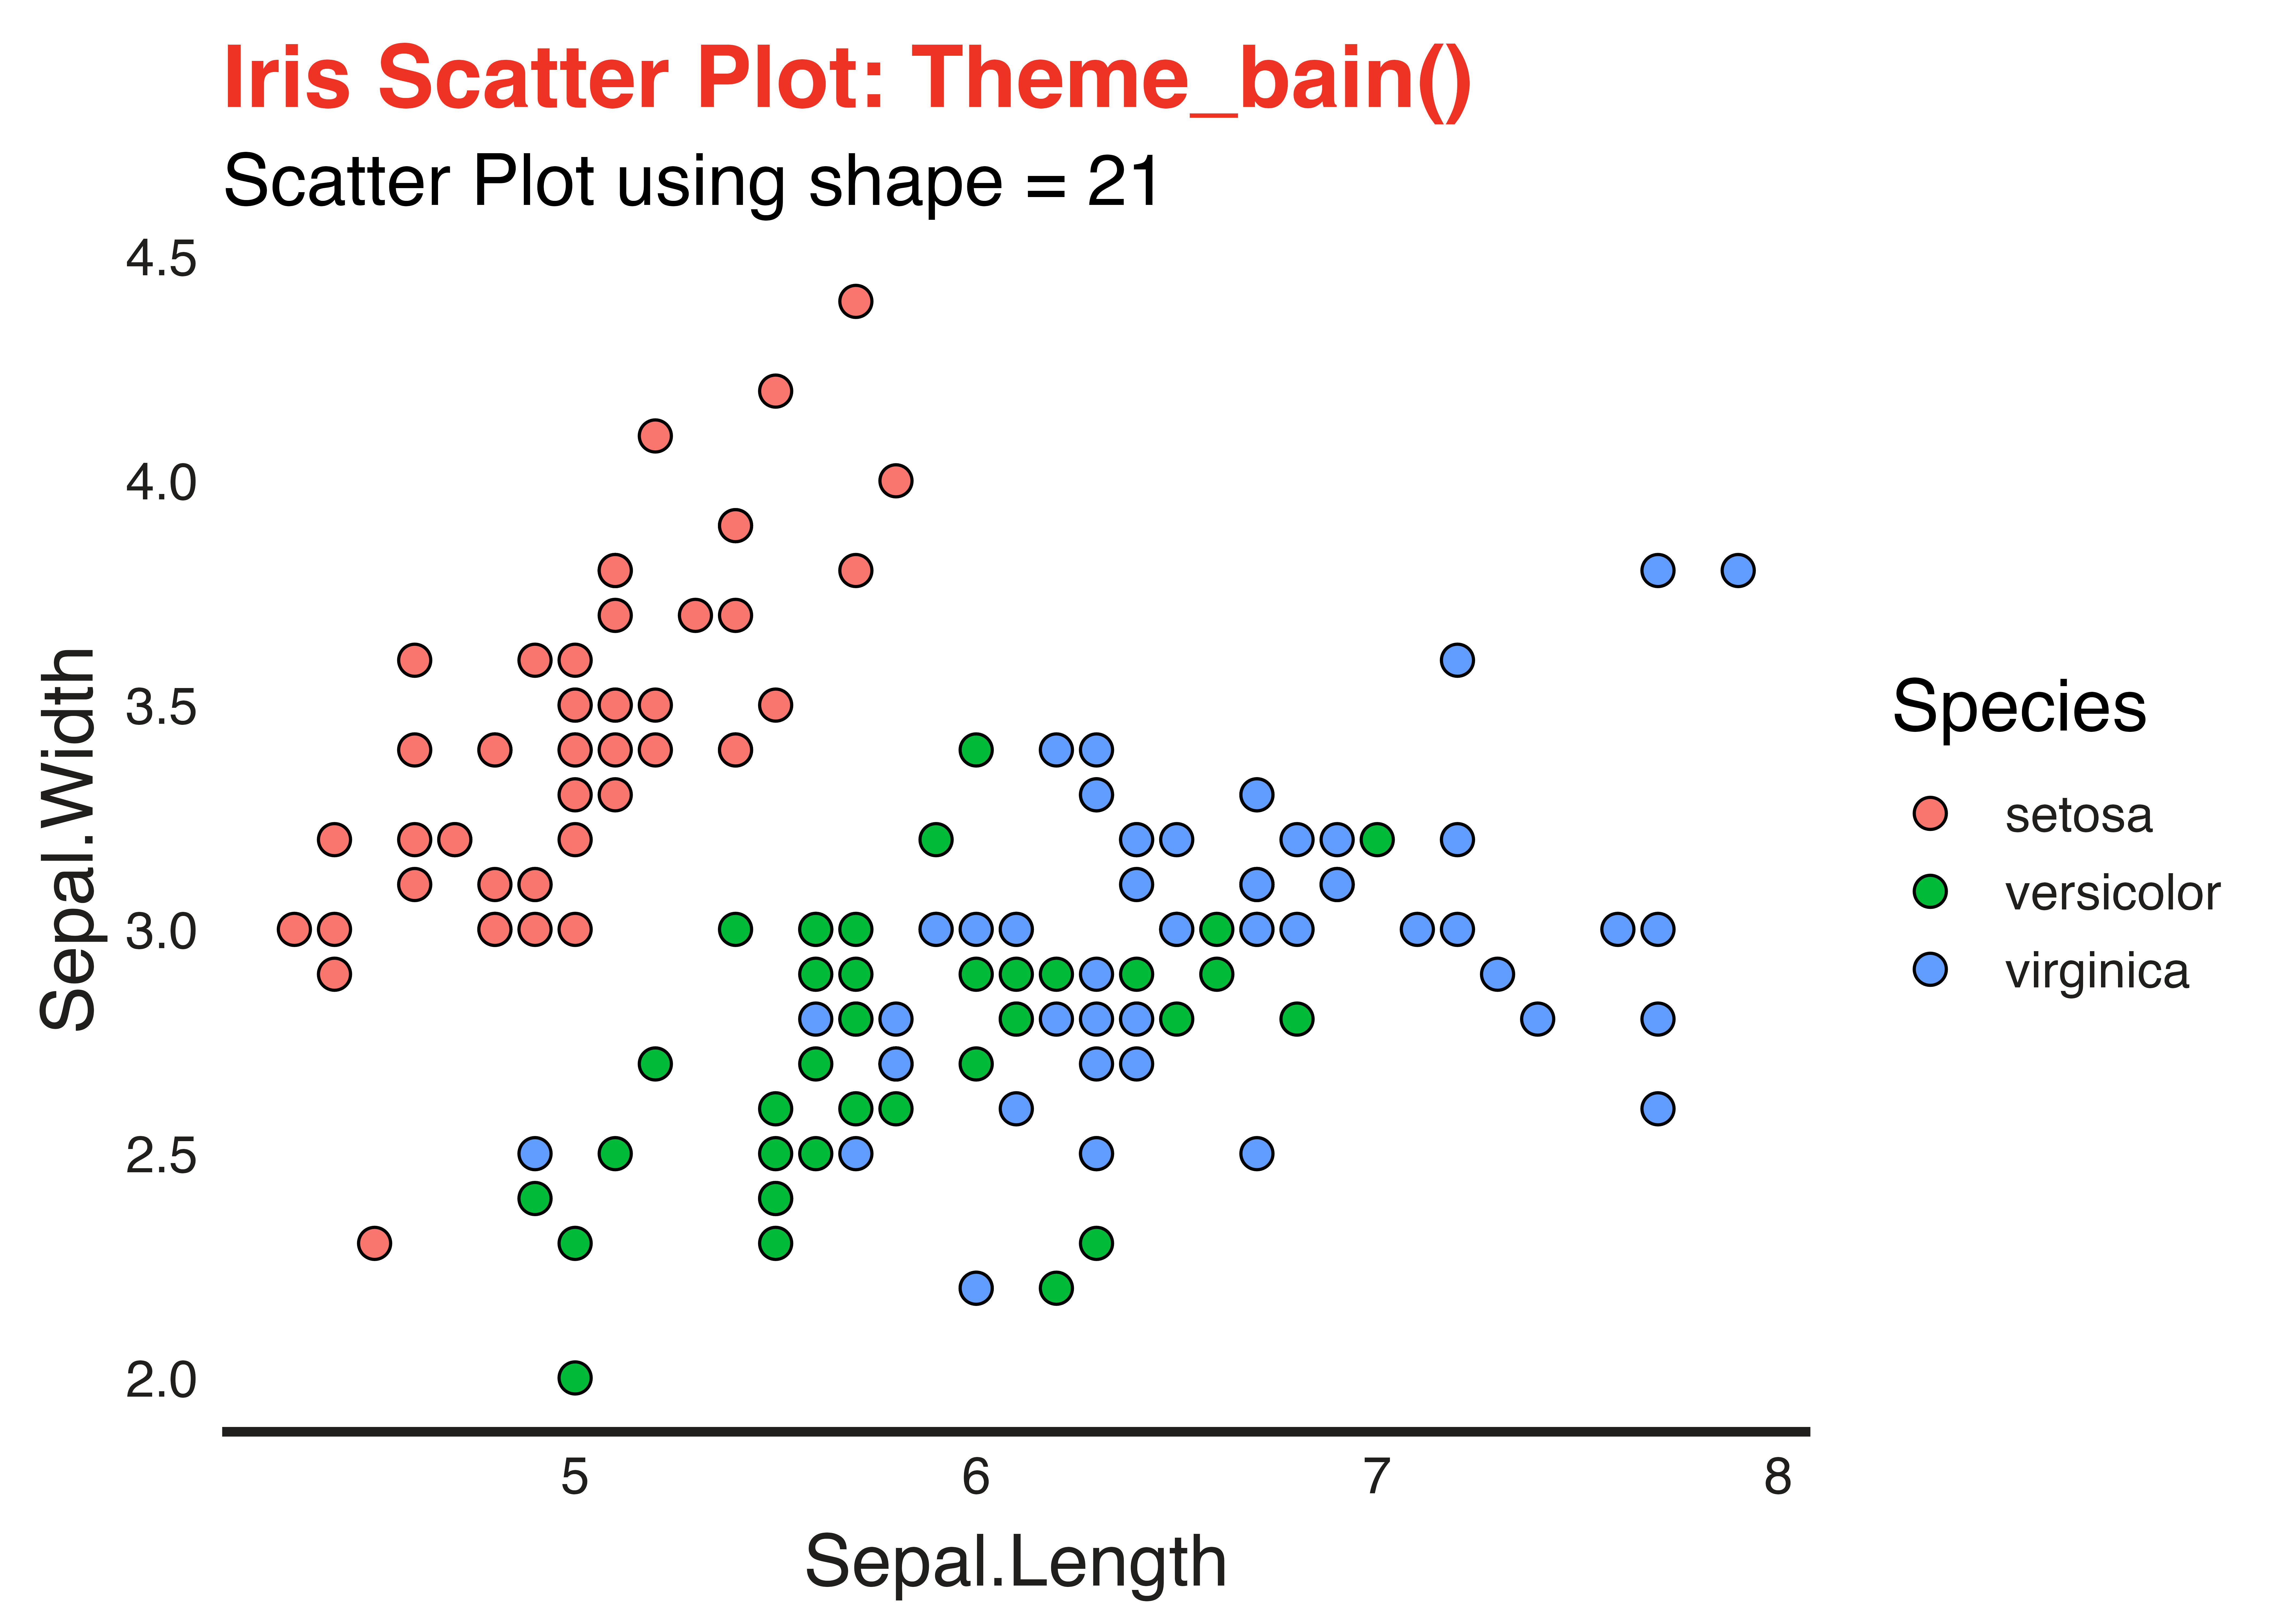
Sample Shape = 21
options(repr.plot.width = 10, repr.plot.height = 8)

# scatter plot with shape = 21
scatter = ggplot( data = iris,
                  aes( x = Sepal.Length,
                       y = Sepal.Width,
                       fill = Species)) +
                  geom_point( shape=21, size=4,  color='black') +
                  theme_bain() +
                  labs( title = "Iris Scatter Plot: Theme_bain() ",
                        subtitle = "Scatter Plot using shape = 21") +
                  theme( text = element_text(size = 20) )

scatter
Sample Shape = 8
# scatter plot with shape = 8
scatter = ggplot( data = iris,
                  aes( x = Sepal.Length,
                       y = Sepal.Width,
                       color = Species )) +
                  geom_point( shape = 8, size = 4, fill = "seagreen") +
                  theme_bain() +
                  labs( title = "Iris Scatter Plot: Theme_bain() ",
                        subtitle = "Scatter Plot using shape = 8") +
                  theme(text = element_text(size = 20))

scatter
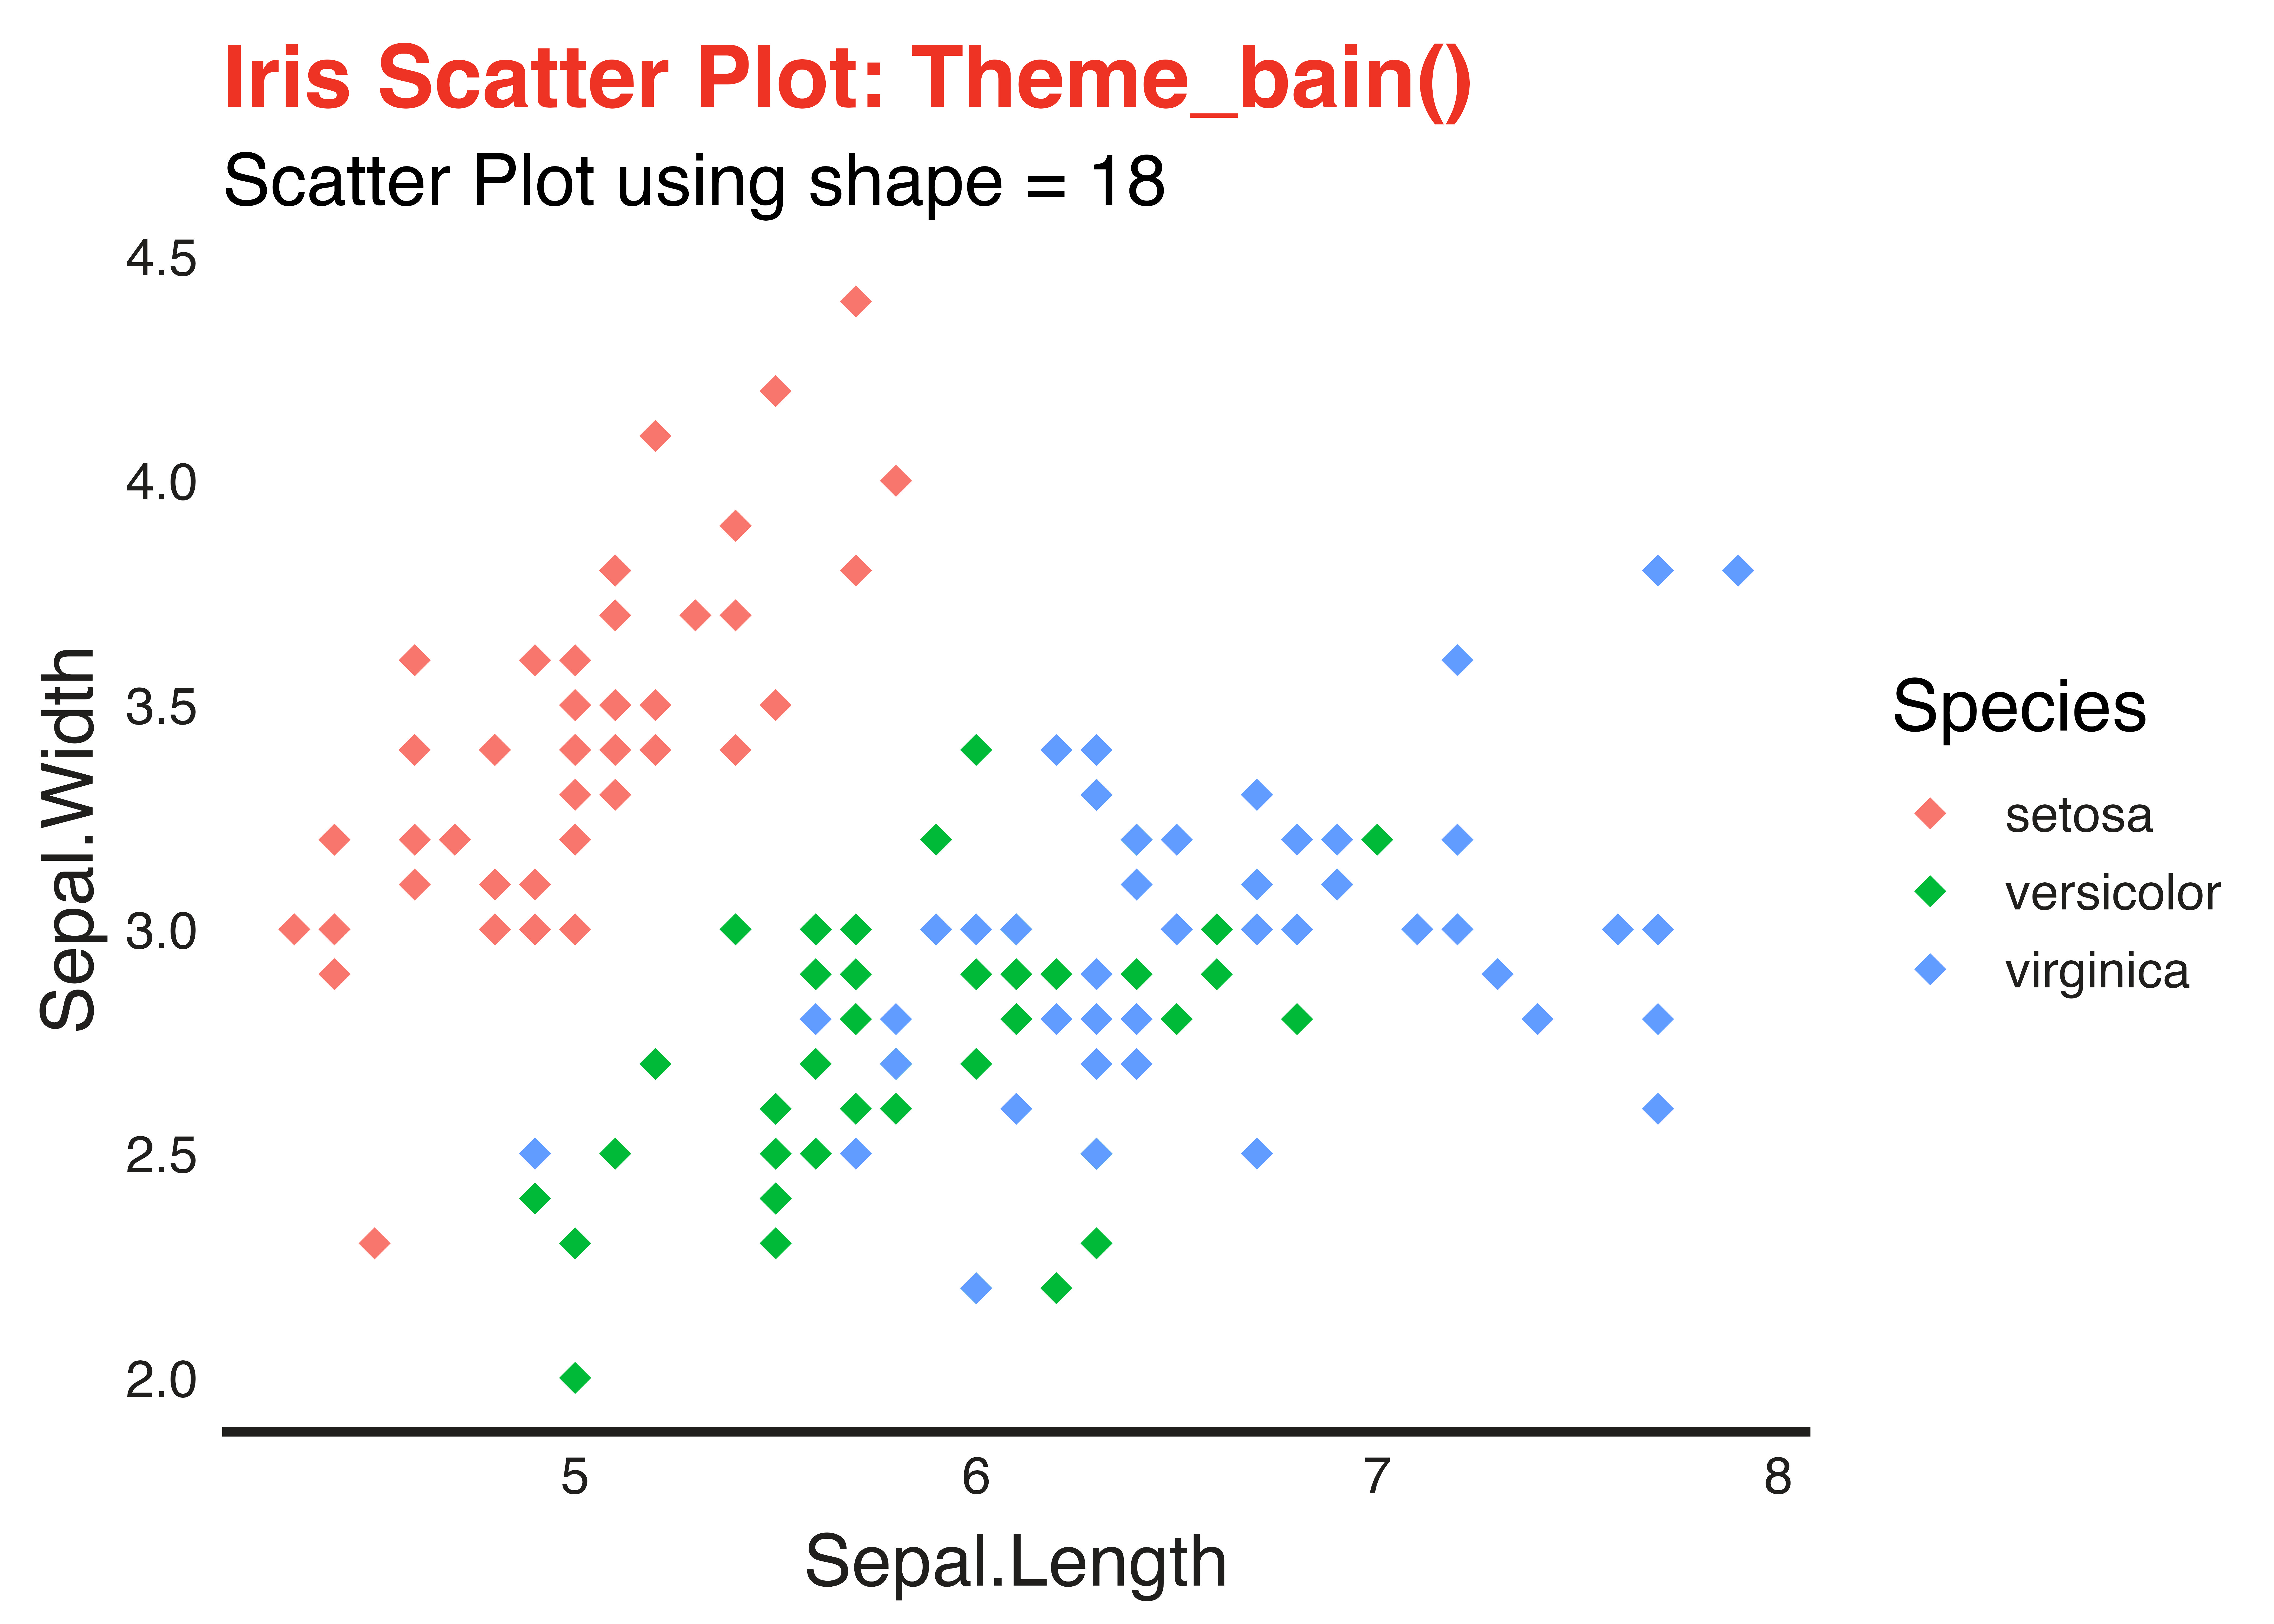
Sample Shape = 18
# scatter plot with shape = 18
scatter = ggplot( data = iris,
                  aes( x = Sepal.Length,
                       y = Sepal.Width,
                       color = Species )) +
                  geom_point( shape = 18, size = 6) +
                  theme_bain() +
                  labs( title = "Iris Scatter Plot: Theme_bain() ",
                        subtitle = "Scatter Plot using shape = 18") +
                  theme(text = element_text(size = 20))

scatter