Imperative Interface vs. Declarative Interface
Matplotlib offers two interfaces to generate visualizations. The most commonly used, due to its simplicity, is the MATLAB-style imperative interface that calls the plot method directly from the Matplotlib class, aggregating both Figure and Axes into a single command. Here is an example of the imperative interface.
Imperative Interface
import matplotlib.pyplot as plt
import numpy as np

%config InlineBackend.figure_format = 'retina'

# Generate data
x = np.linspace(0, 2*np.pi, 100)
y = np.sin(x)

# Create a plot using the imperative interface
plt.plot(x, y, label='Sine Curve')
plt.title('Imperative Interface Example')
plt.xlabel('X-axis')
plt.ylabel('Y-axis')
plt.legend()
plt.show()
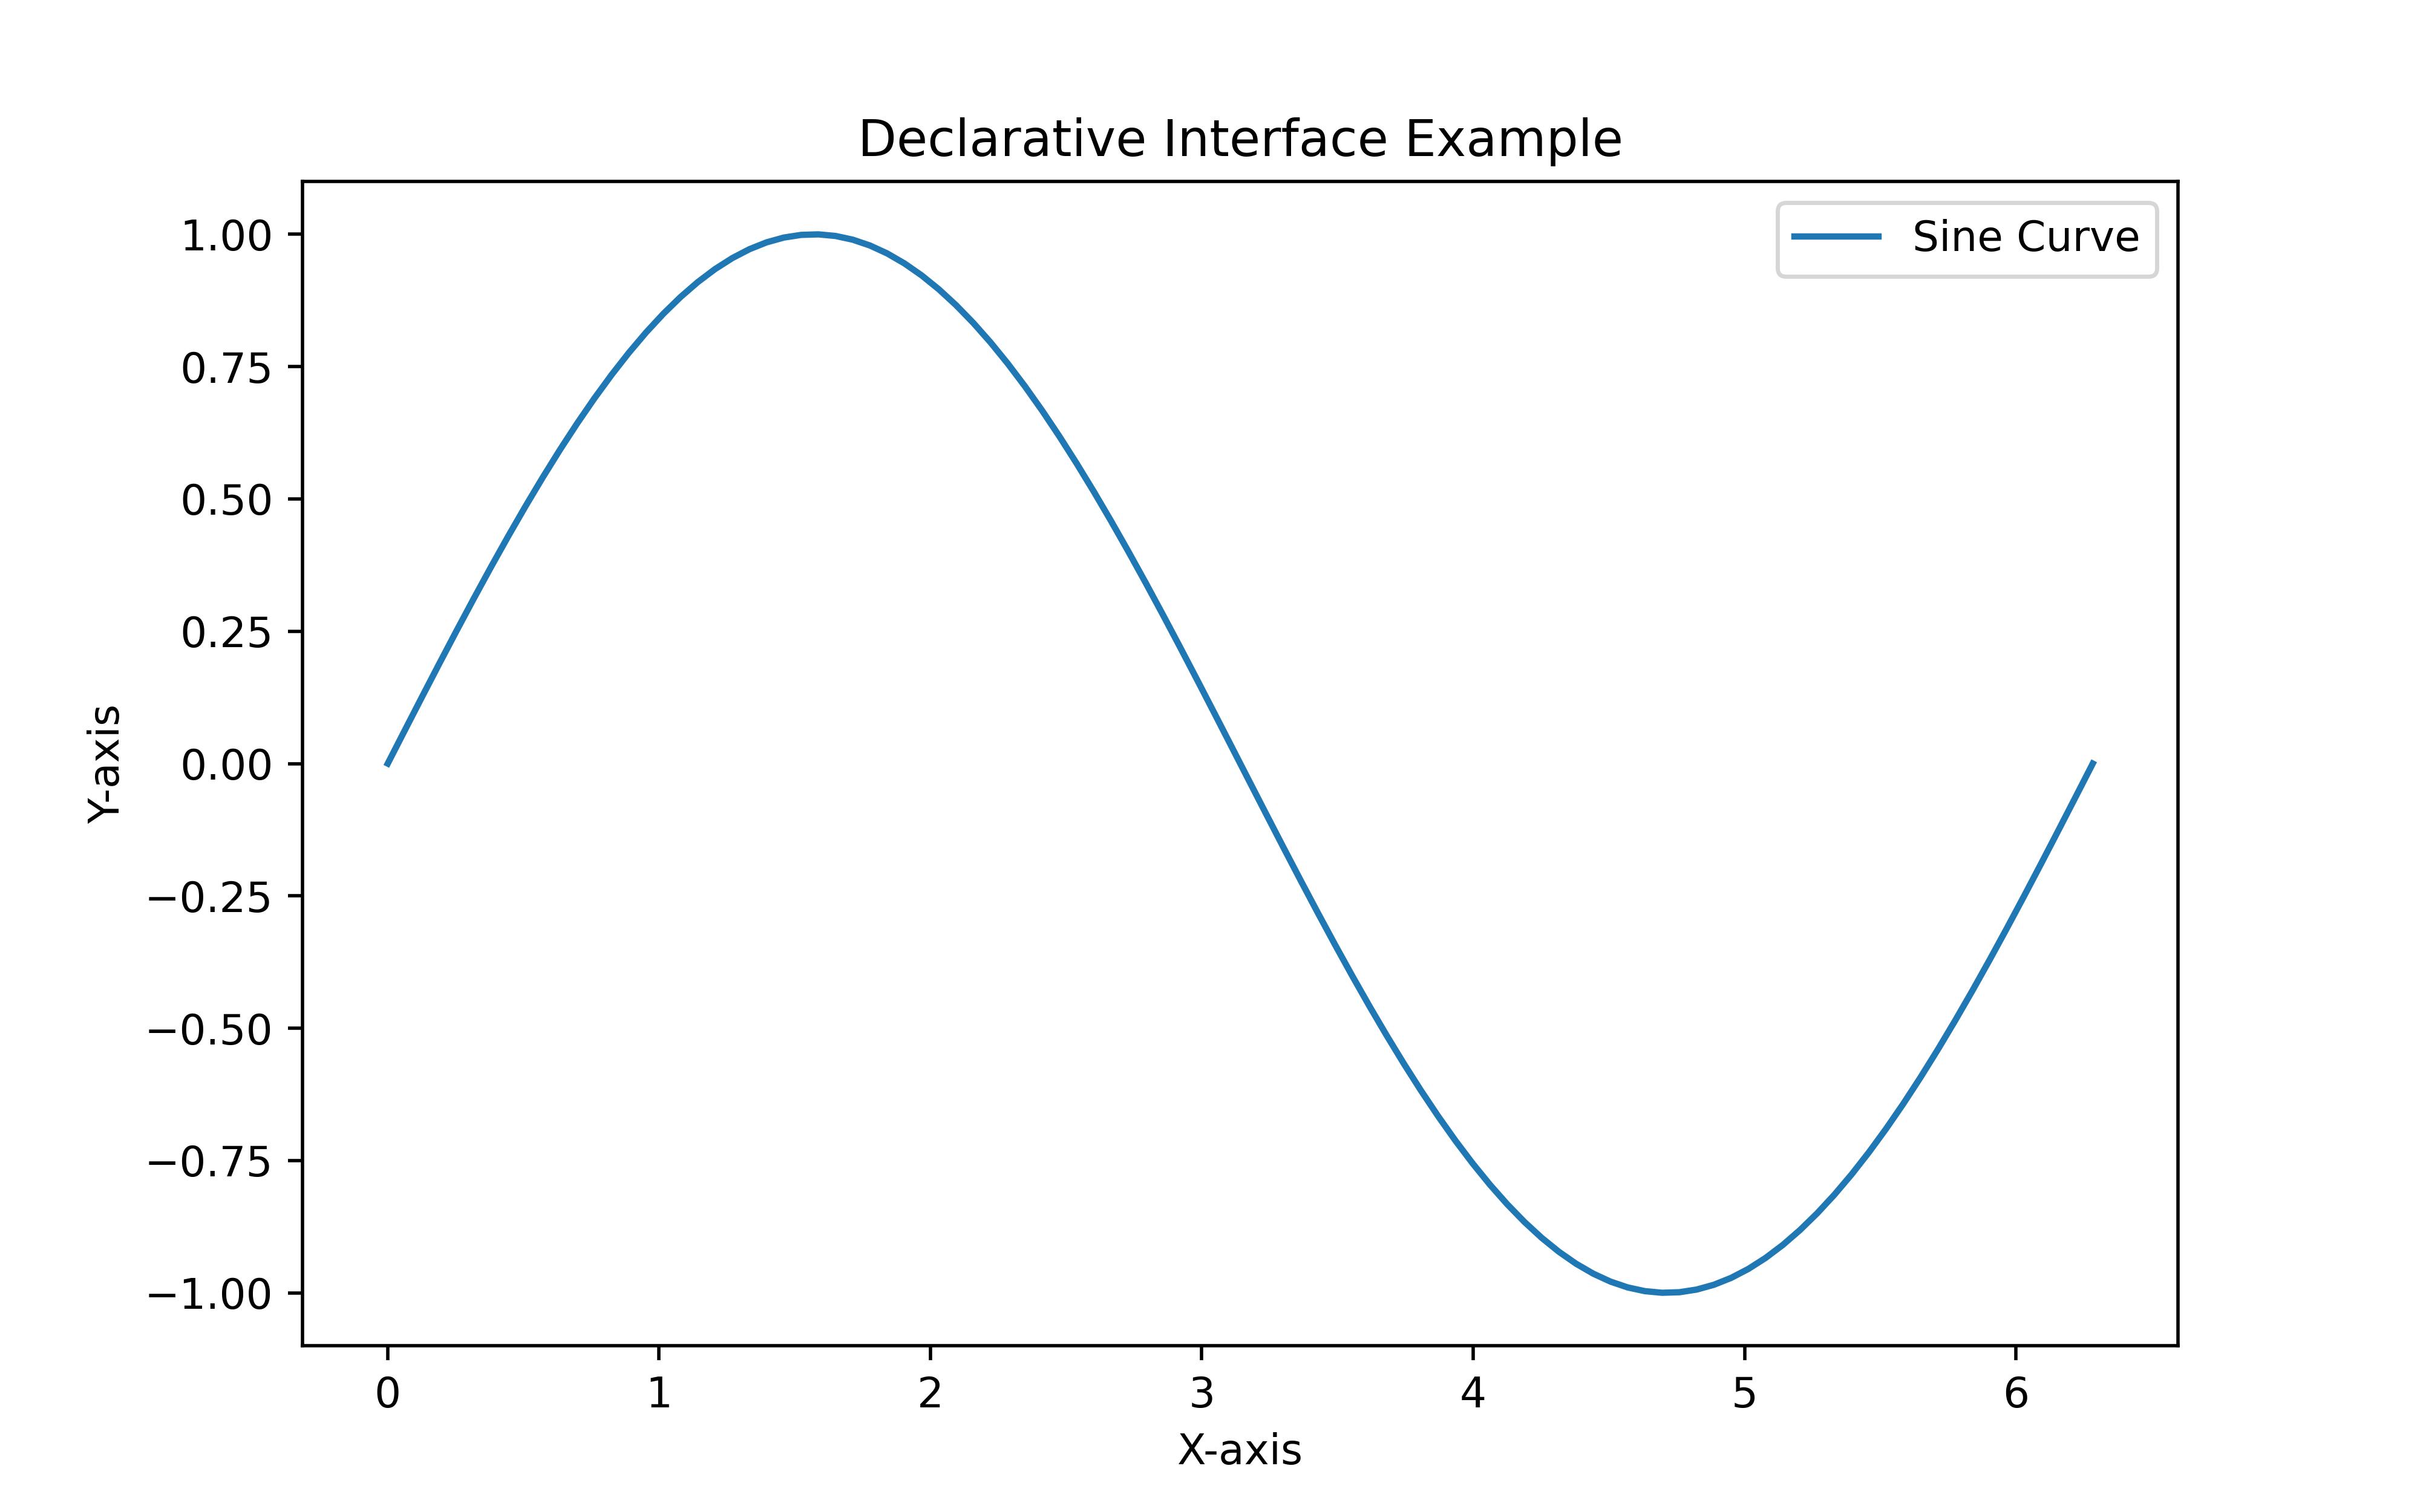
Declarative or Object Interface
The alternative and more powerful interface is the object interface. Although it requires more code, it provides users with greater flexibility in developing complex visualizations. In the following example, I replicate the imperative example above using the Object Interface paradigm.
fig, ax = plt.figure( figsize=(8,5)), plt.axes()

# Generate data
x = np.linspace(0, 2*np.pi, 100)
y = np.sin(x)

ax.plot( x, y, label='Sine Curve')
ax.set_title('Declarative Interface Example')
ax.set_xlabel('X-axis')
ax.set_ylabel('Y-axis')
ax.legend()
plt.show()
This collection of Matplotlib uses the Object or Declarative Paradigm to develop visualizations. Its benefits become more apparent with more complex features.