The Axes Object
Matplotlib's Axes object is where the data gets plot. The object controls all the data related properties including
To demonstrate the effectiveness of the Axes object, let's begin with a basic plot.
import numpy as np
import matplotlib.pyplot as plt

%matplotlib inline
%config InlineBackend.figure_format = 'retina'
# Plotting the sine wave
fig, ax = plt.figure(figsize=(8,5), dpi=500, facecolor='seagreen'), plt.axes()

# x and y values
x = np.linspace(0, 2 * np.pi, 100)
y = np.sin(x)

# plots data
ax.plot(x, y)
ax.set_title('Sine Wave')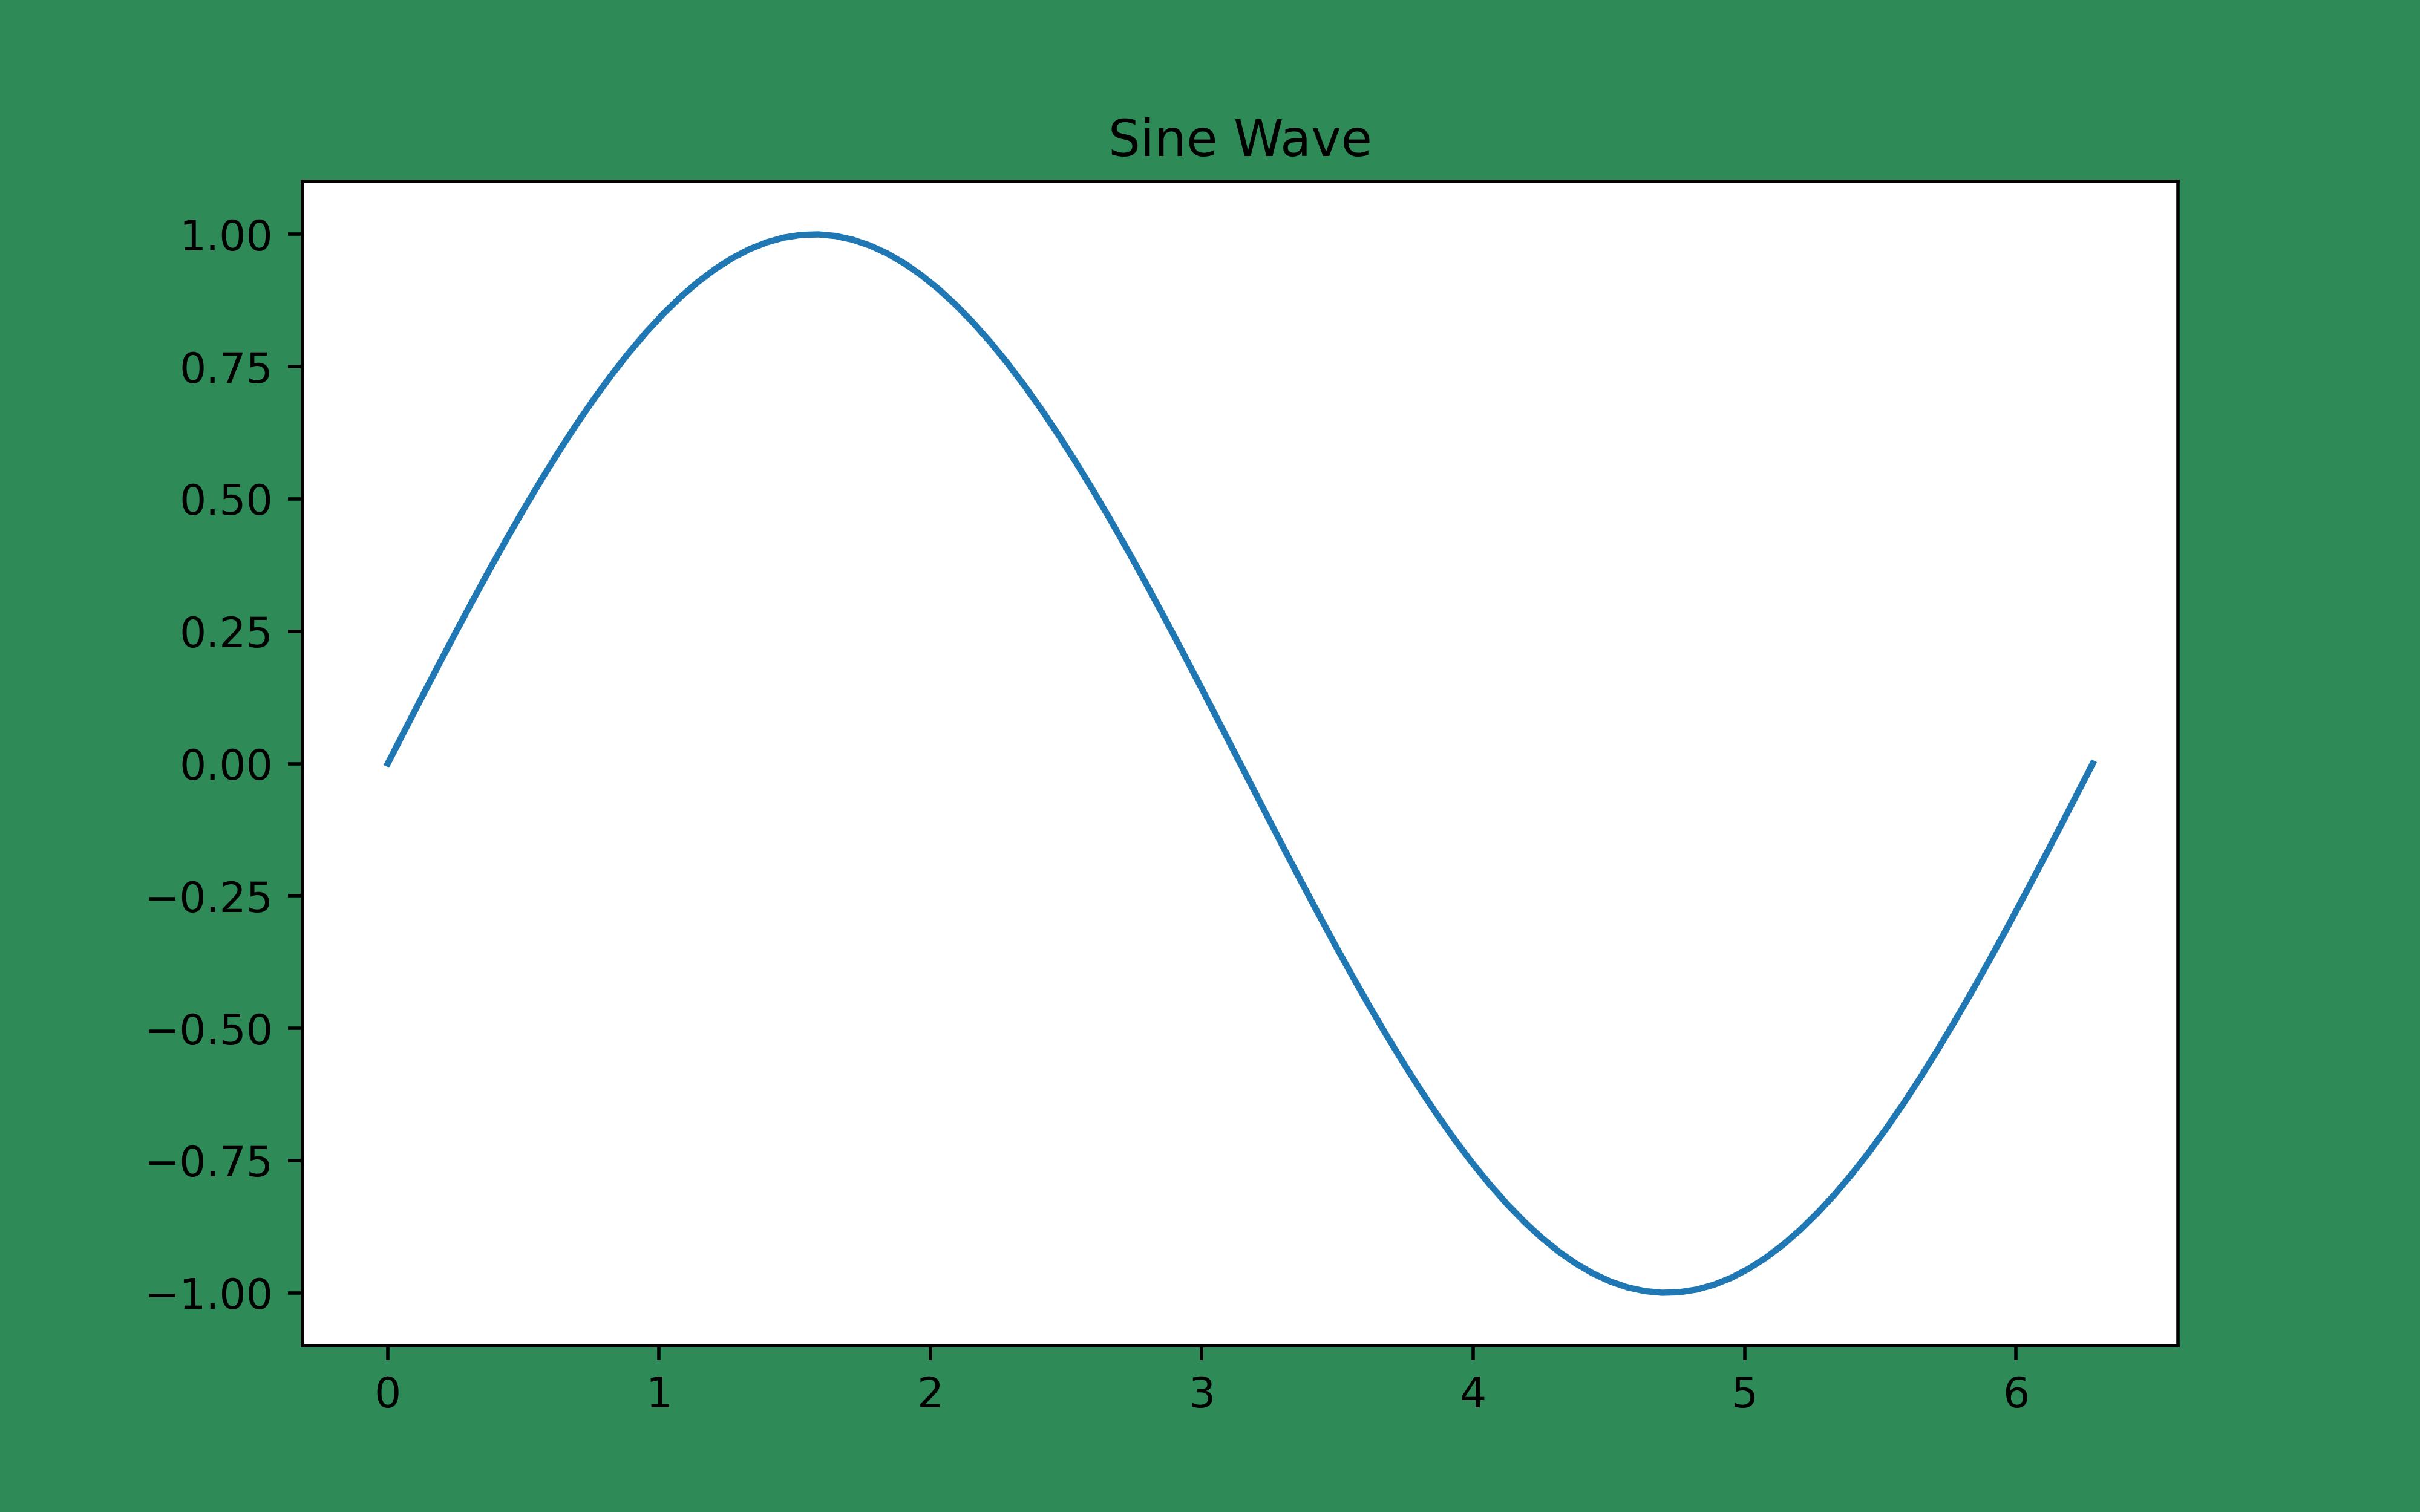
Customizing the Axis
The
fig, ax = plt.figure(figsize=(8,5), dpi=500), plt.axes()

# x and y values
x = np.linspace(0, 2 * np.pi, 100)
y = np.sin(x)

# plots data
ax.plot(x, y)
ax.set_title('Sine Wave - No Axis')
ax.axis('off')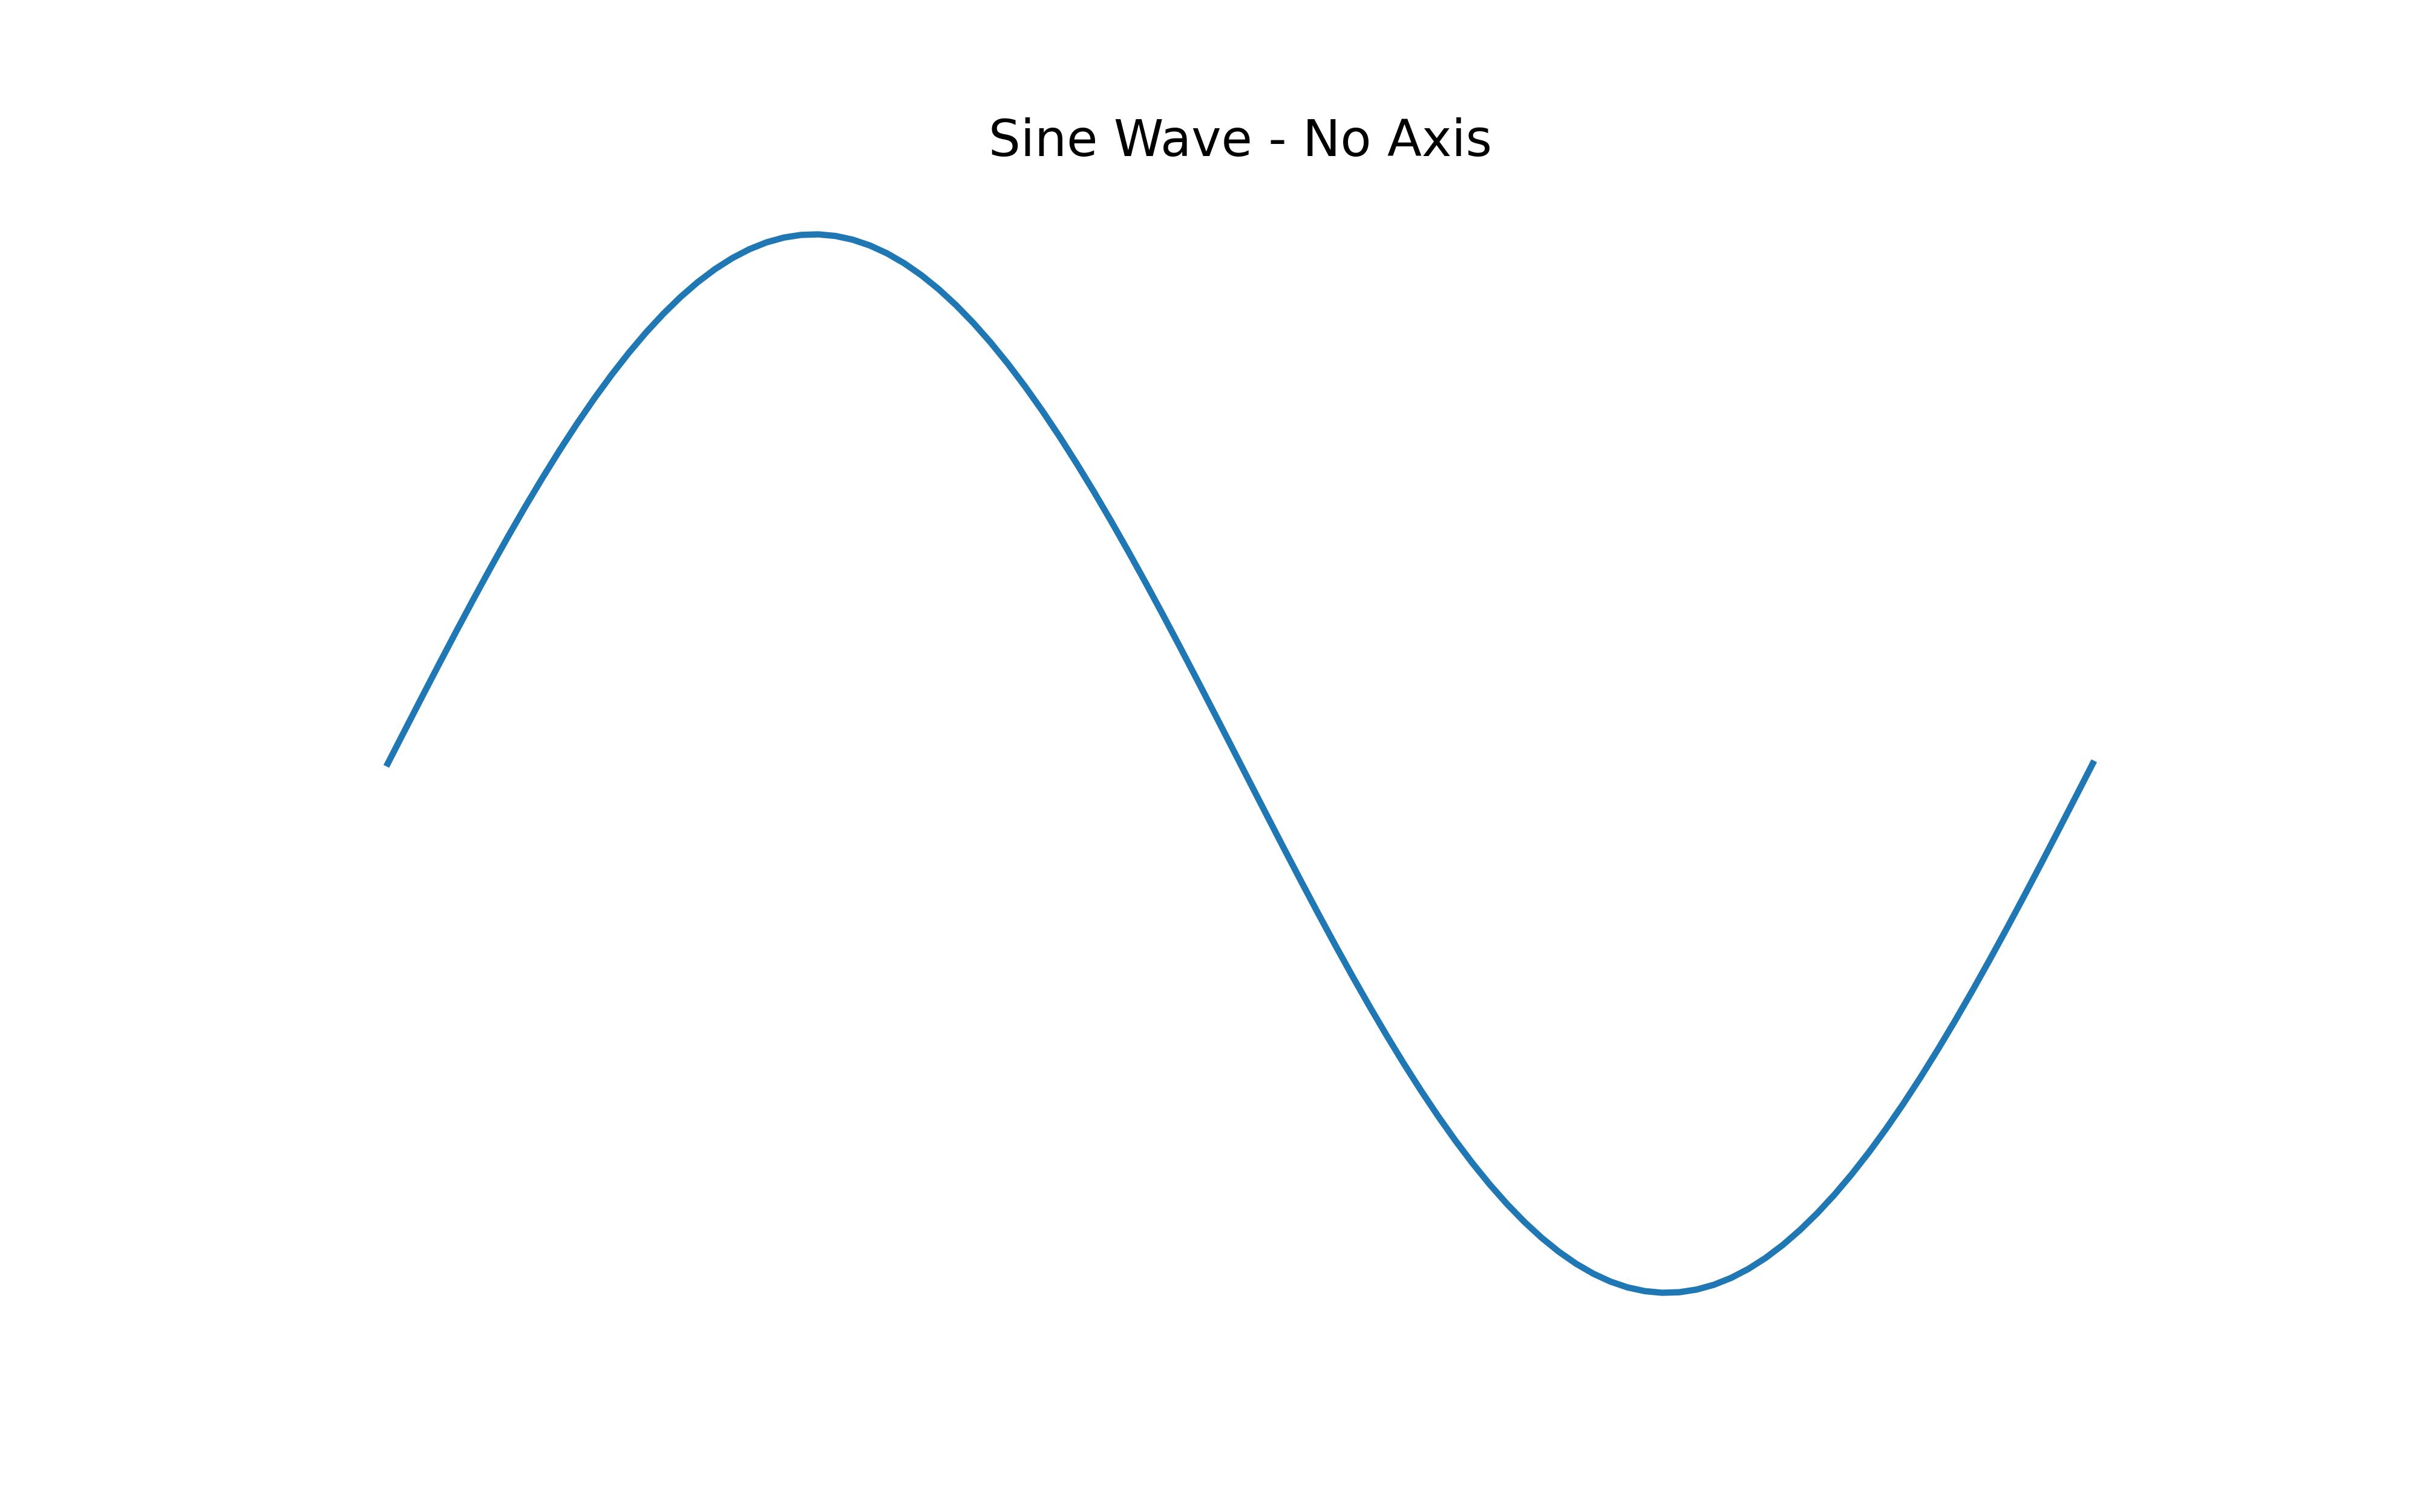
Customizing Spines
In the example below I remove the top, left and right spines (setting them to false) and leave the bottom spine to create a number line effect on the sine wave chart
fig, ax = plt.figure(figsize=(8,5), dpi=500), plt.axes()

# x and y values
x = np.linspace(0, 2 * np.pi, 100)
y = np.sin(x)

# plots data
ax.plot(x, y)
ax.set_title('Sine Wave - No Axis')

ax.spines[['top', 'left', 'right']].set_visible(False)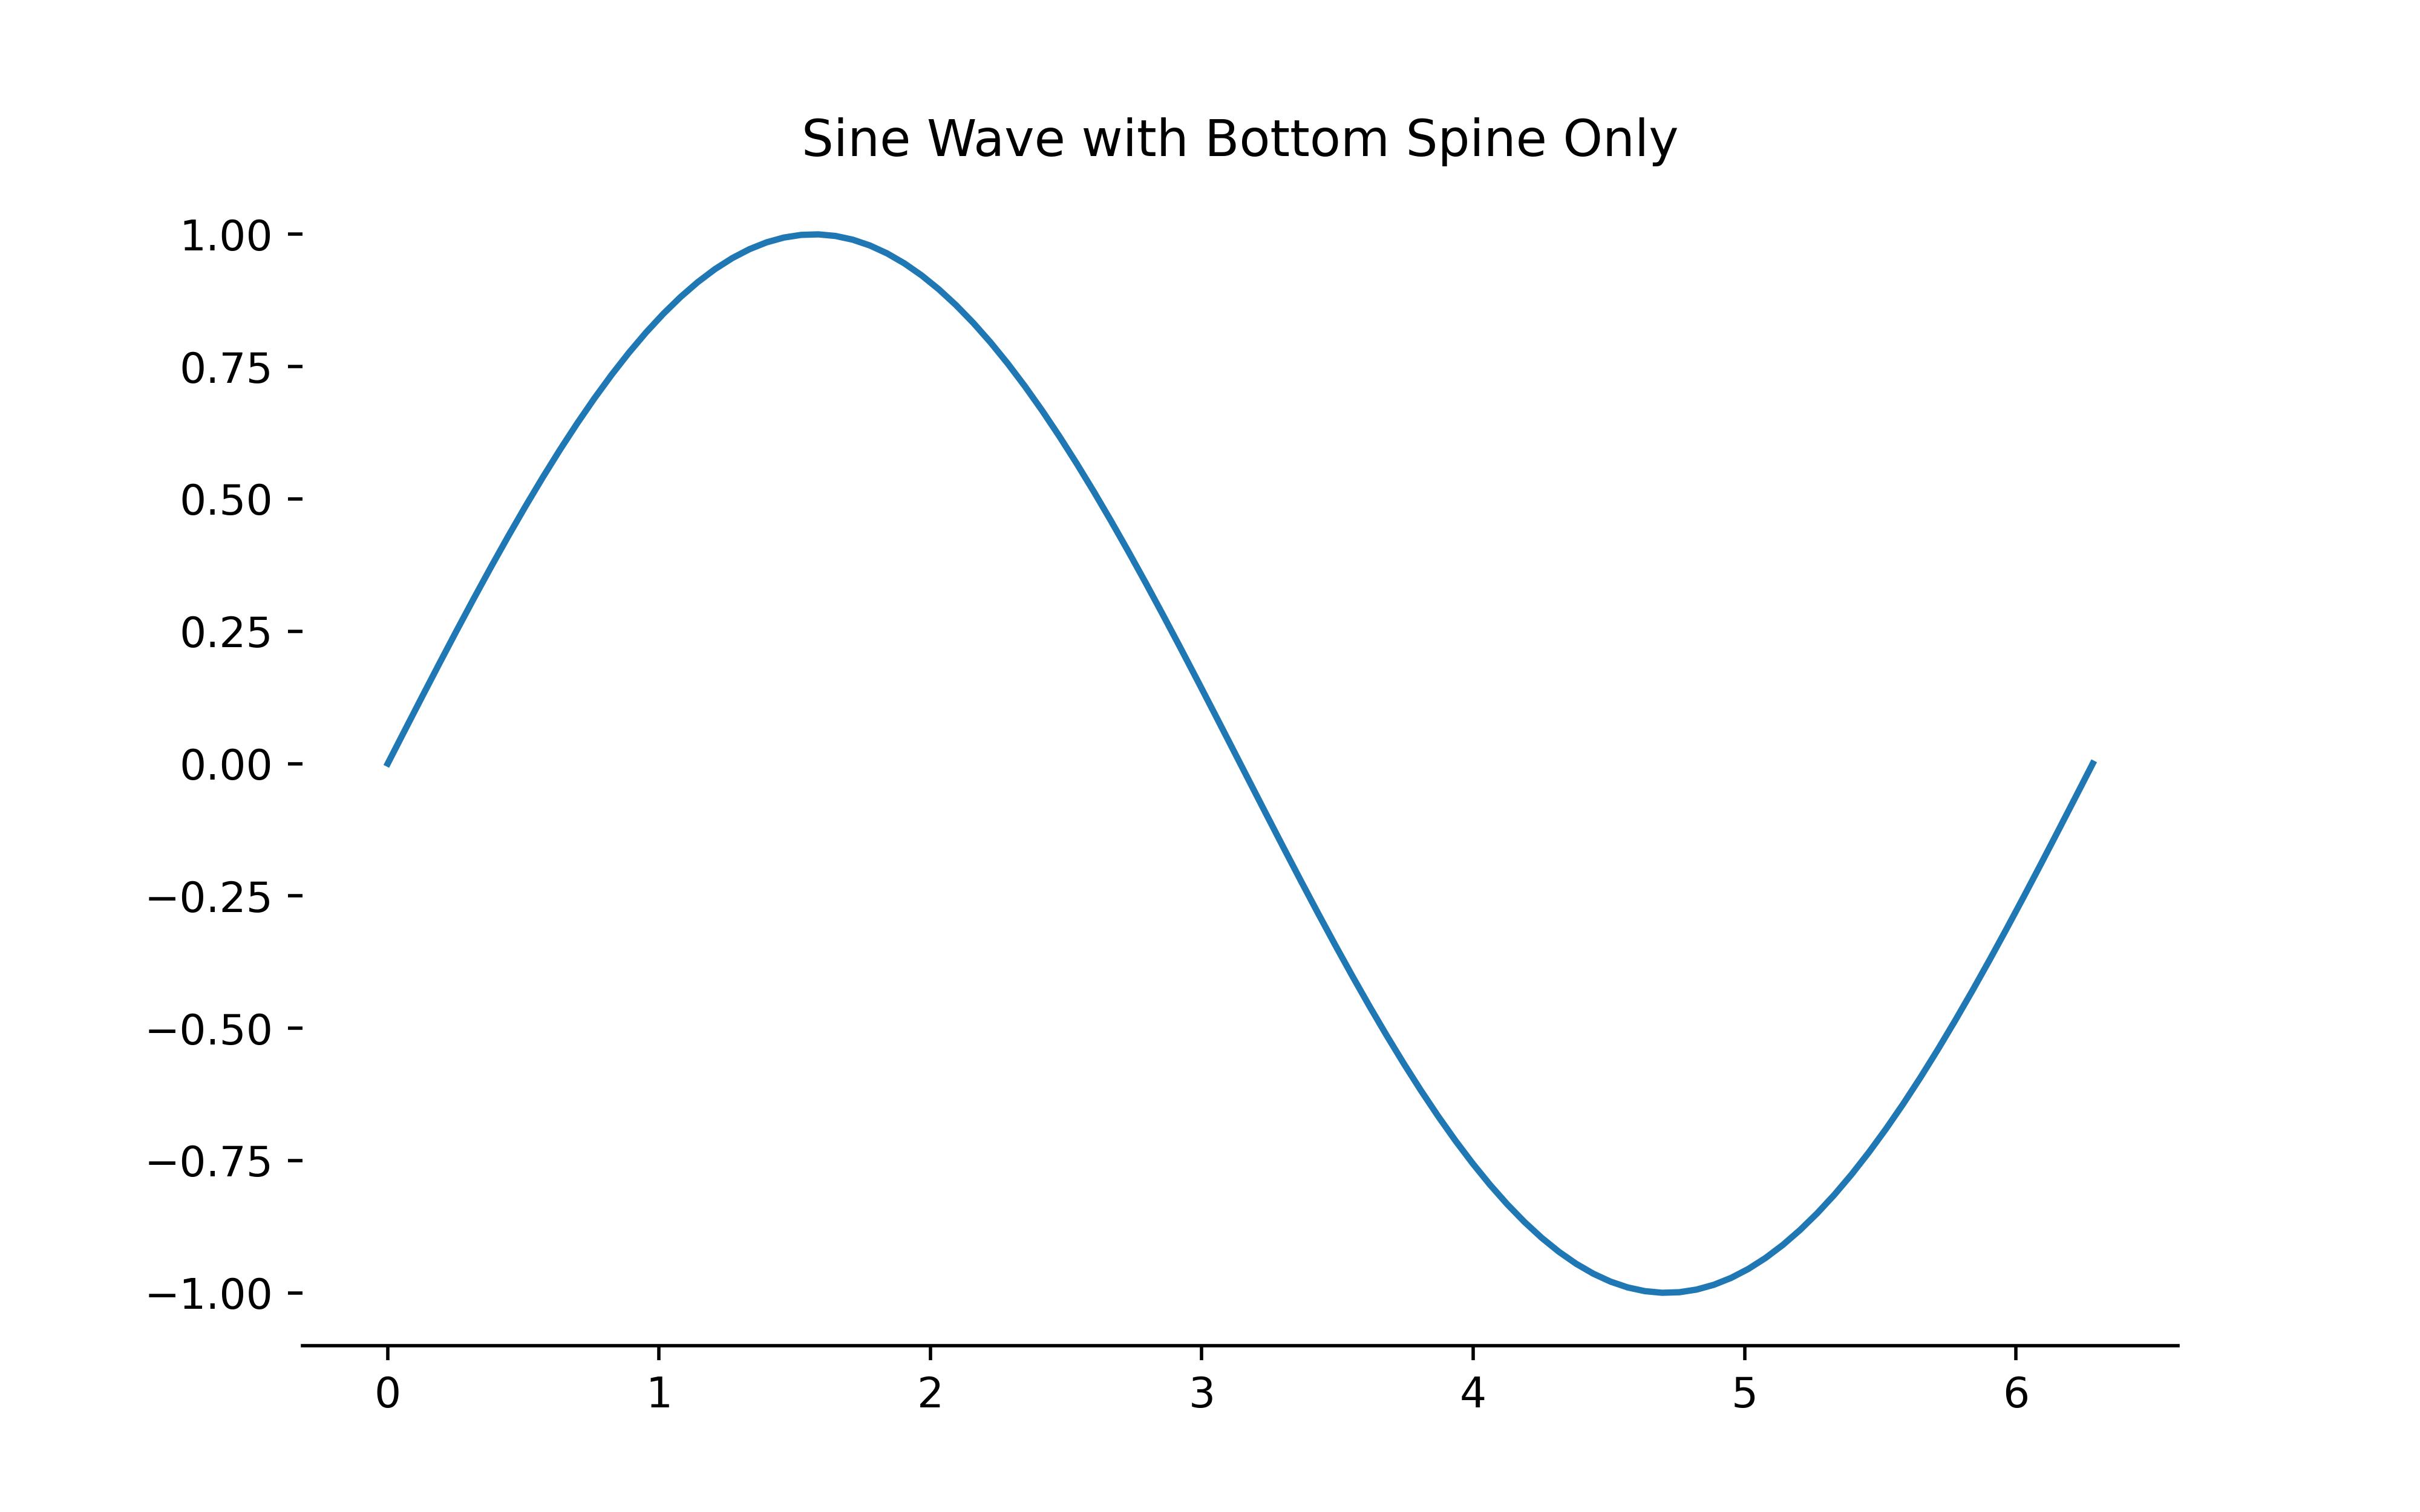
The examples above are just a few modification that can be made on the ax object to change the configuration and style of the plot. In the next sections, we deal with each major aspect of Axes as we develop more interesting visuals.