Figure Object
In matplotlib, the Figure object is the canvas for which any visualization can be generated. It is the top-level container that holds every items in the plot including axes, labels, legends, annotations and more.
The figure object has a few structural and cosmetic arguments that can help you tailor the visual representation of
your data. These include parameters such as
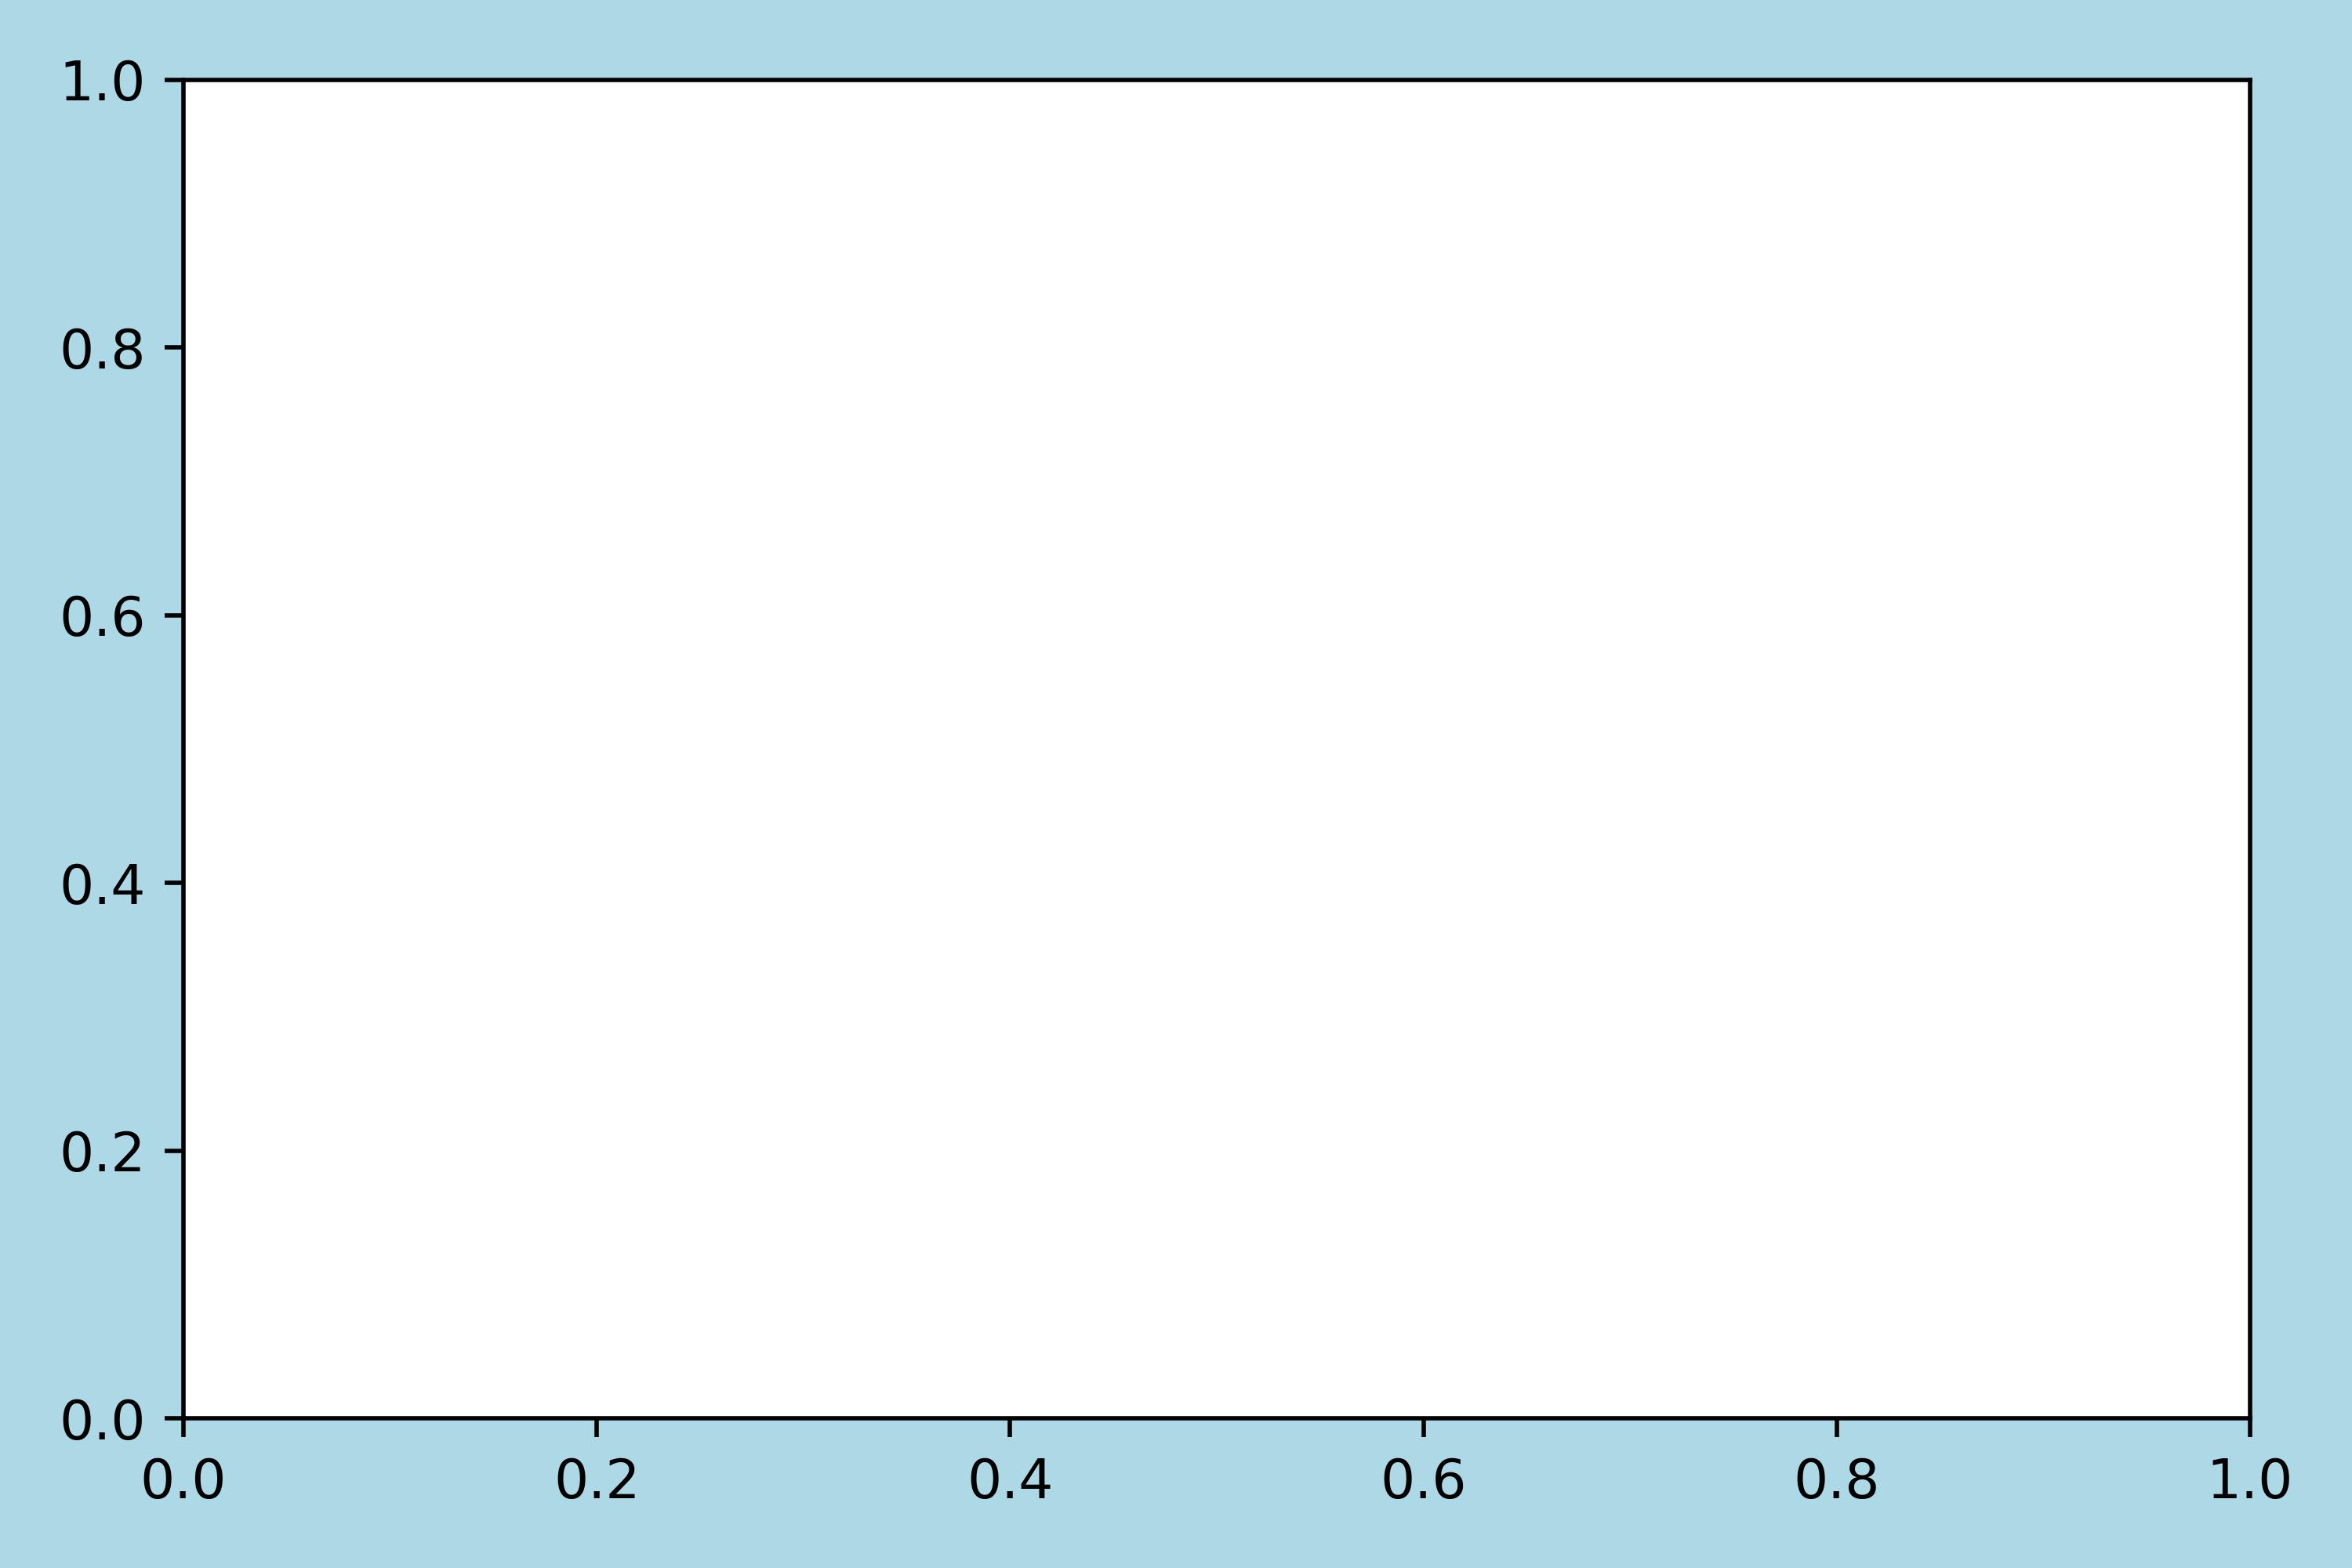
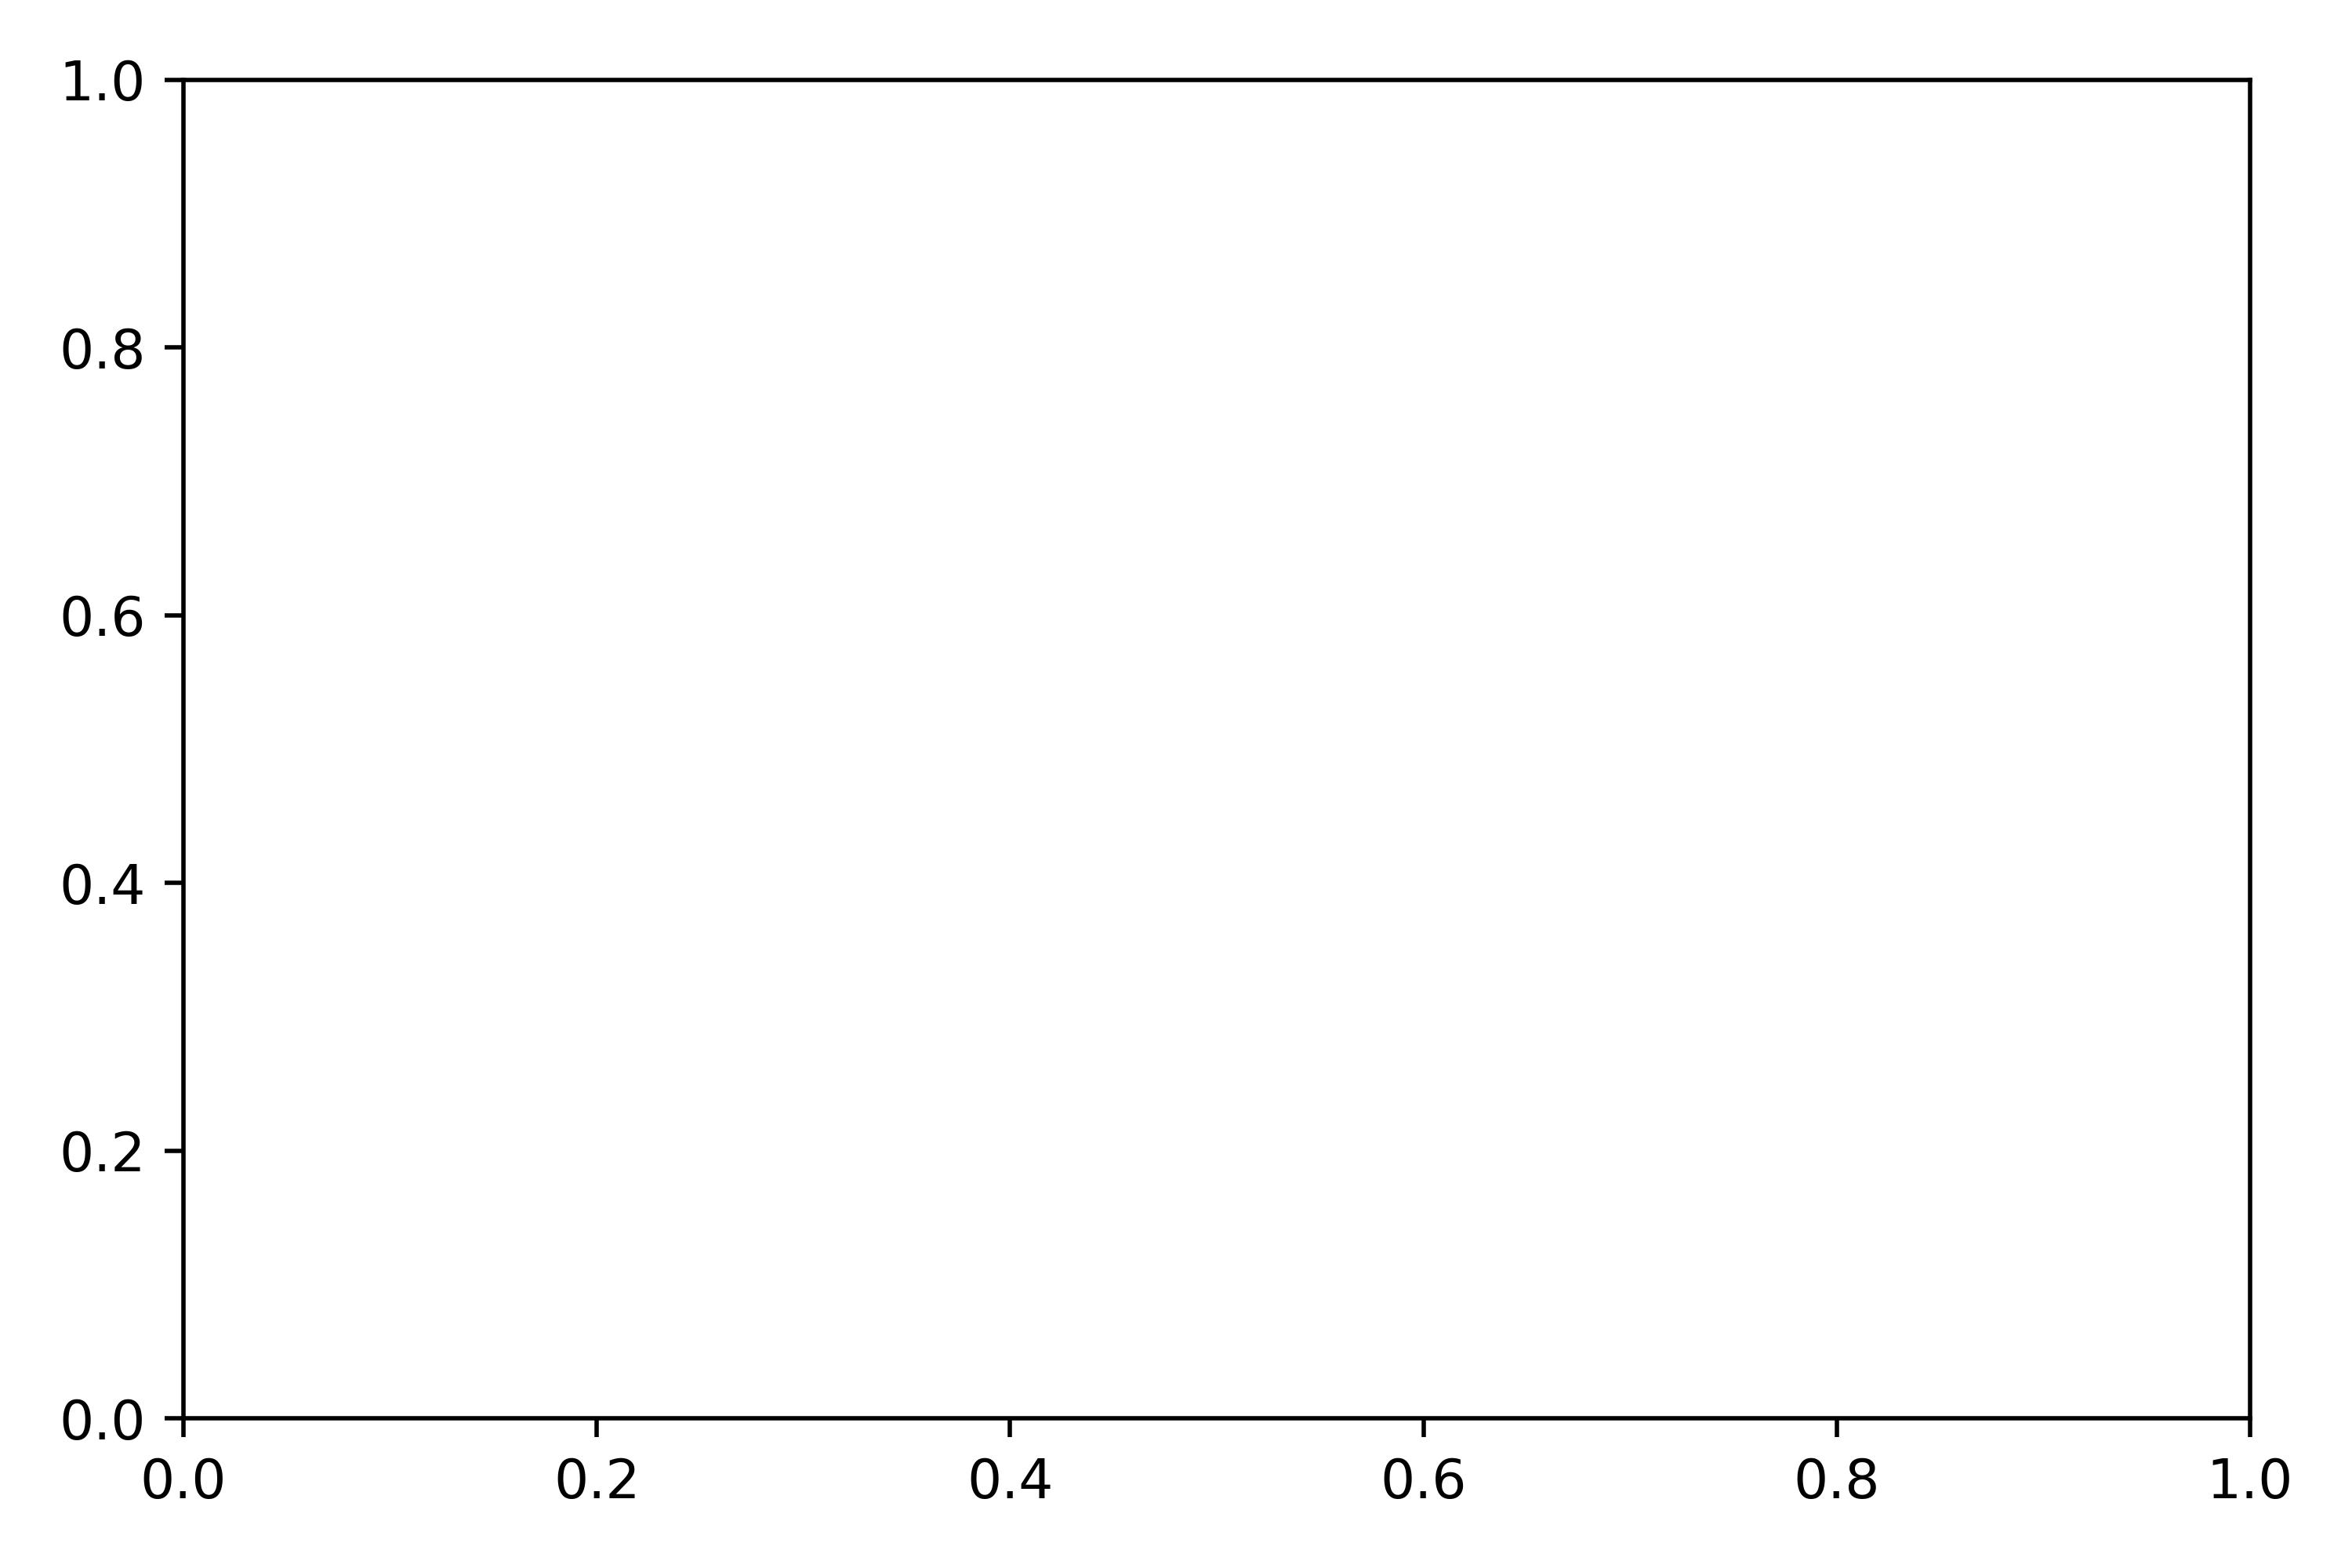
The example below demonstrates the use of these arguments.
import numpy as np
import matplotlib.pyplot as plt

%matplotlib inline
%config InlineBackend.figure_format = 'retina'

fig, ax = plt.figure( figsize=(8,5),
                      dpi=500,
                      frameon=True,
                      layout = 'tight' ), plt.axes()
fig, ax = plt.figure( figsize=(8,5), dpi=500, frameon=False, layout = 'tight' ), plt.axes()
The Figure object is the foundation of any matplotlib visualization and as seen above, in combination with the axes object (which we see in the next chapter), gives you the power to create custom visualization to meet your needs.