Edge Detection Filters
There are several edge detection techniques and kernels that provide useful features from images for higher level processing like object detection. We will look at edge detection techniques in the next section, however, on this section, we look at examples of kernels that enhance edges of an image. Examples of these kernels are:
$$ \begin{pmatrix} -1 & -1 & -1 \\ -1 & 8 & -1 \\ -1 & -1 & -1 \end{pmatrix}, \begin{pmatrix} 1 & 0 & -1 \\ 0 & 0 & 0 \\ -1 & 0 & 1 \end{pmatrix} $$
In the example below, we implement and perform edge detection using the above example kernels.
import cv2
import numpy as np
import matplotlib.pyplot as plt

%matplotlib inline
%config InlineBackend.figure_format = 'retina'
img = cv2.imread('cat.jpg')
img = cv2.cvtColor(img, cv2.COLOR_BGR2RGB)
# plot the image
plt.imshow(img)
plt.axis('off')
Defining edge detection filters
edge_kernel = np.array([
    [1, 0, -1],
    [0, 0,  0],
    [-1, 0, 1]])


edge_kernel_2 = np.array([
    [-1, -1, -1],
    [-1,  8, -1],
    [-1, -1, -1]])


edge_kernel_3 = np.array([
    [-1, -1, -1, -1, -1],
    [-1, -1, -1, -1, -1],
    [-1, -1, 24, -1, -1],
    [-1, -1, -1, -1, -1],
    [-1, -1, -1, -1, -1]])
Implementing convolution
# convolving img wit filters
edge_img = cv2.filter2D(img, -1, edge_kernel)
edge_img_2 = cv2.filter2D(img, -1, edge_kernel_2)
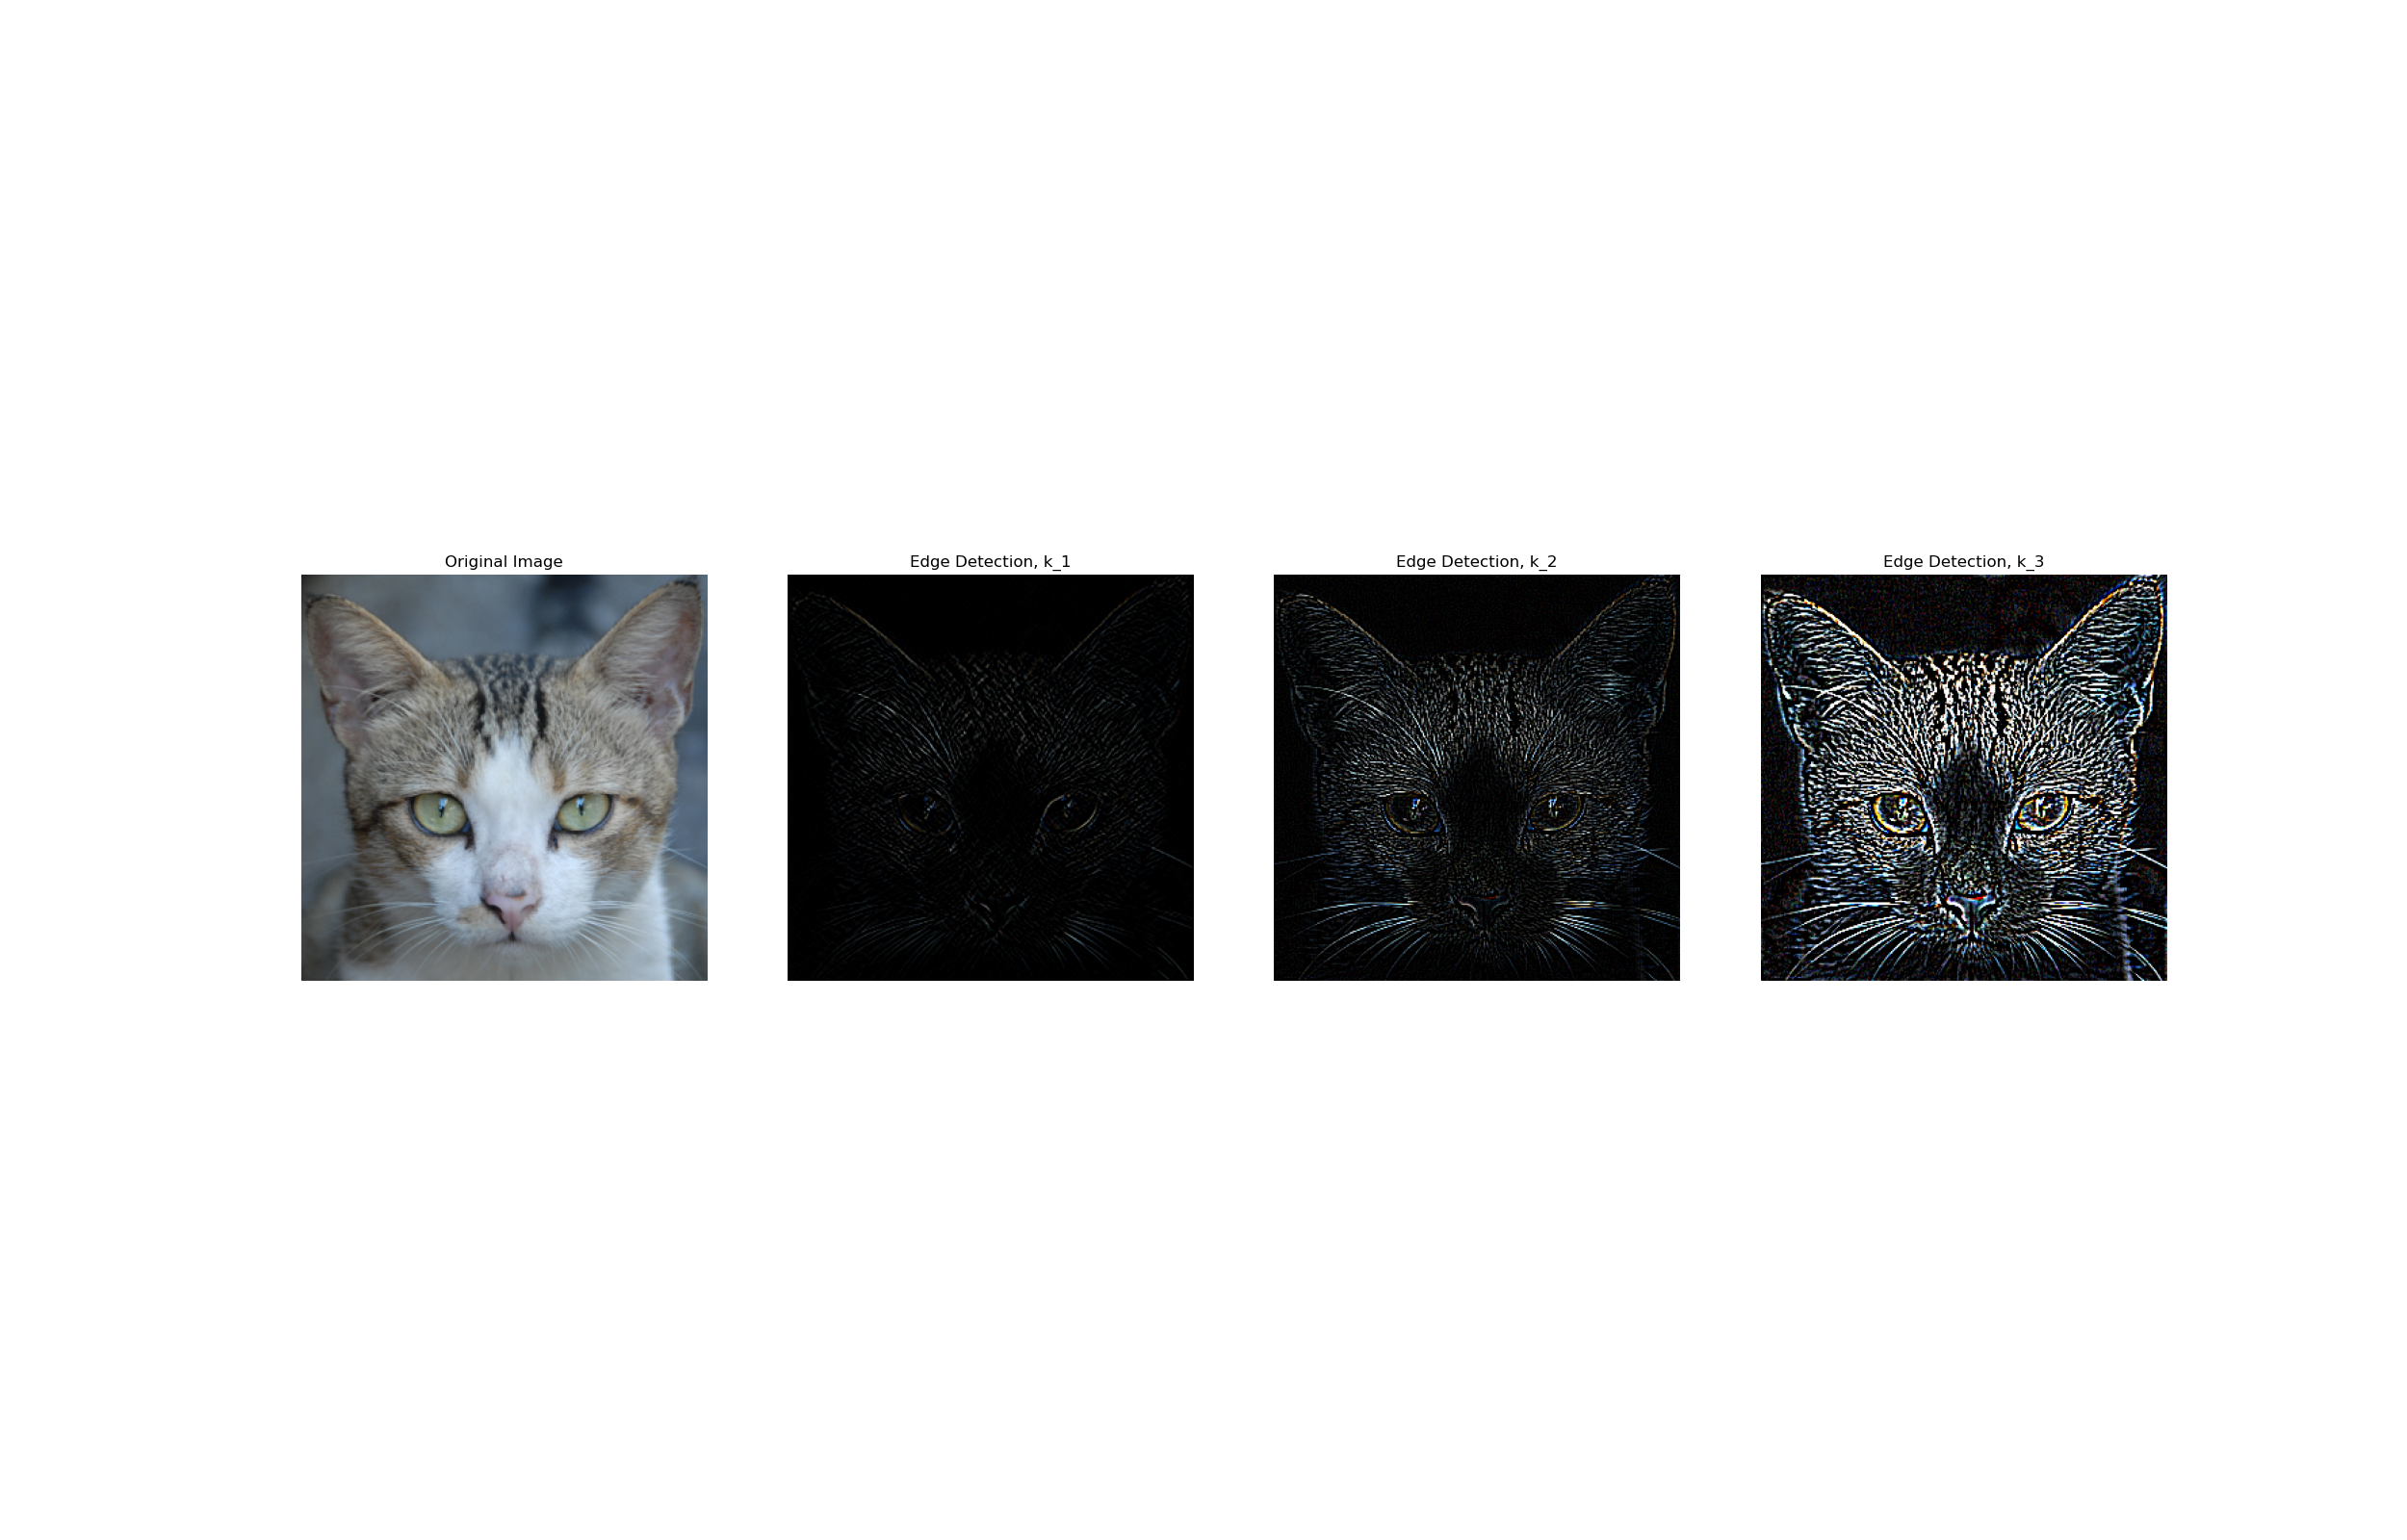
edge_img_3 = cv2.filter2D(img, -1, edge_kernel_3)#visualizing the filtered images
fig = plt.figure(figsize=(25,16))
fig.add_subplot(141)
plt.imshow(img)
plt.title('Original Image')
plt.axis('off')
fig.add_subplot(142)
plt.imshow(edge_img)
plt.title('Edge Detection, k_1')
plt.axis('off')
fig.add_subplot(143)
plt.imshow(edge_img_2)
plt.title('Edge Detection, k_2')
plt.axis('off')
fig.add_subplot(144)
plt.imshow(edge_img_3)
plt.title('Edge Detection, k_3')
plt.axis('off')