Sharpen Images with Filters
The sharpen filter improve the sharpness of an image by enhancing the edges or boundaries of an image. To achieve this effect, we often need a kernel that will assign a high weight to the center pixel while have lower weights on the closest neighbors. Two examples of the sharpen filter is:
$$\begin{pmatrix} 0 & -1 & 0 \\ -1 & 5 & -1 \\ 0 & -1 & 0 \end{pmatrix}, \begin{pmatrix} -1 & -1 & -1 \\ -1 & 9 & -1 \\ -1 & -1 & -1 \end{pmatrix} $$
In the above examples, we have kernels that magnifies the center pixel with weight $5$ and $9$ while reducing the effect of the neighboring pixels with weights $-1$ and $0$.
Implementation with OpenCV
import cv2
import numpy as np
import matplotlib.pyplot as plt

%matplotlib inline
%config InlineBackend.figure_format = 'retina'
img = cv2.imread('cat.jpg')
img = cv2.cvtColor(img, cv2.COLOR_BGR2RGB)
# plot the image
plt.imshow(img)
plt.axis('off')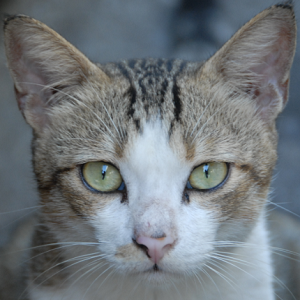
The code below sets up a sharpen kernels in numpy that we will use as a filter to convolve over our image.
sharpen_kernel = np.array([
        [0, -1, 0],
        [-1, 5,-1],
        [0, -1, 0]])

sharpen_kernel_2 = np.array( [
        [-1, -1, -1],
        [-1,  9, -1],
        [-1, -1, -1] ])
Convolving the image with kernels
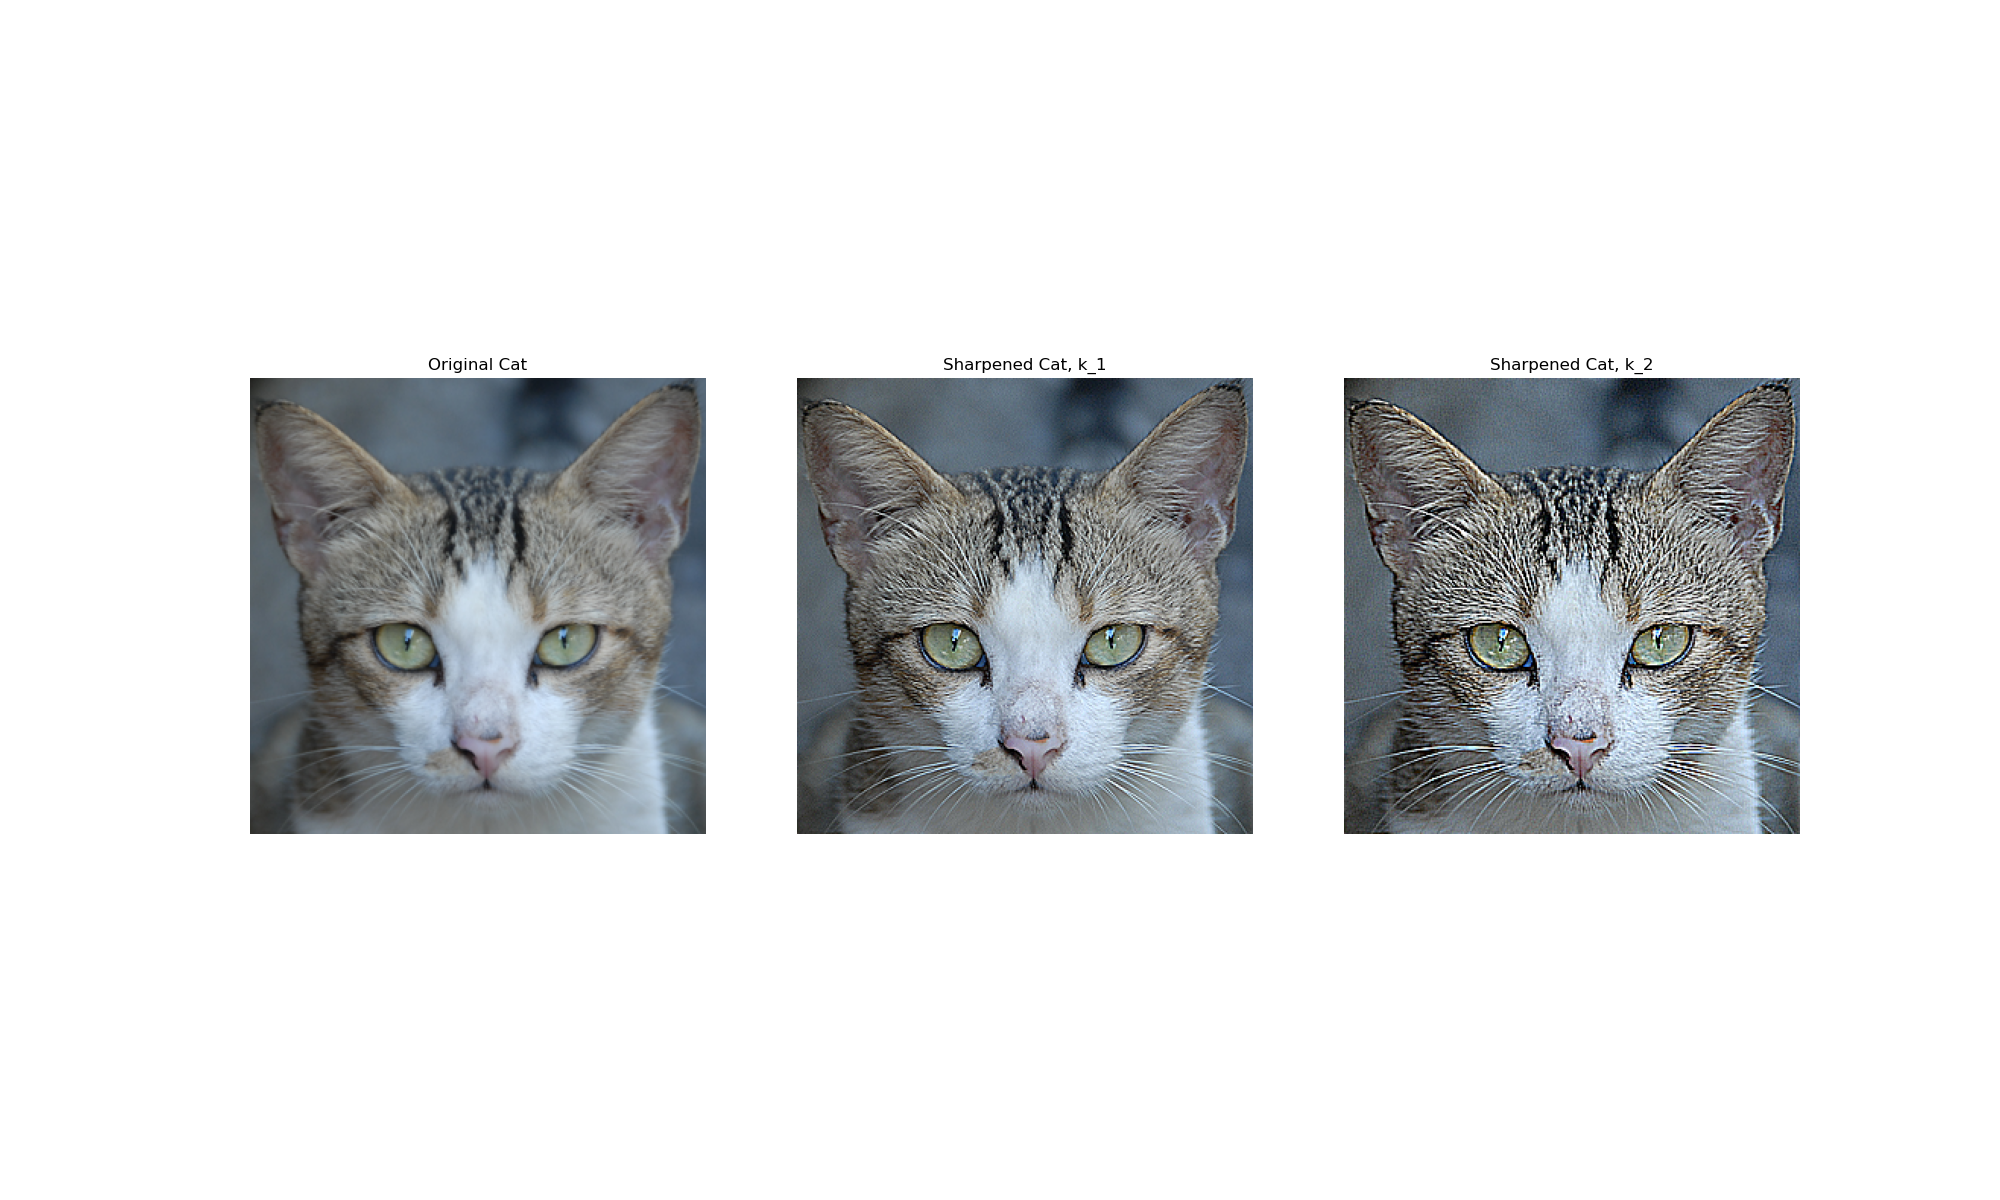
sharpened_img = cv2.filter2D(img, -1, sharpen_kernel)
sharpened_img_two = cv2.filter2D(img, -1, sharpen_kernel_2)
fig = plt.figure(figsize=(20,12))
fig.add_subplot(131)
plt.imshow(img)
plt.title('Original Cat')
plt.axis('off')
fig.add_subplot(132)
plt.imshow(sharpened_img)
plt.title('Sharpened Cat, k_1')
plt.axis('off')
fig.add_subplot(133)
plt.imshow(sharpened_img_two)
plt.title('Sharpened Cat, k_2')
plt.axis('off')